iPlayer Rules Ok - Page 2
On the previous webpage I displayed some graphs that plotted how often the peak sound level reached a given value. Those graphs used the same method as in various previous examinations I have done. This took the sound data, divided into a sequence of 100 msec chunks, and found the peak value in each chunk. It then divided the possible range of power levels into a set of 1dB wide ‘bins’ and counted how many of the chunks had a maximum value that was in the range covered by each ‘bin’. The result then plotted how many of the chunks were in the 0-1dBFS range, how many in the 1-2dBFS range, etc.
This method generally works well when you want to determine the overall spread of the dynamics. However looking at the results I had the impression that the 1dB resolution was too insensitive to tell if the iPlayer results were actually being limited or clipped. So I decided to re-analyse the data, but this time use a finer power resolution.
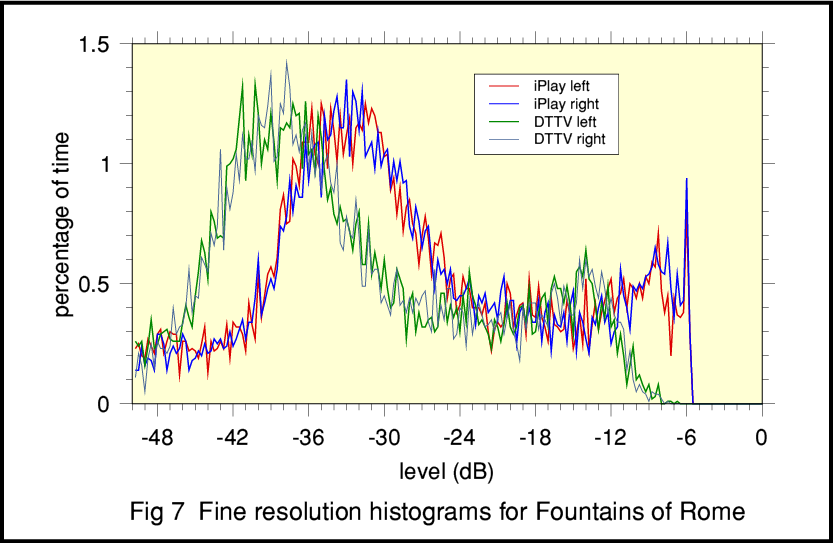
Figure 7 shows an example of what is revealed by using a fine resolution. In this case I chose to divide the peak levels of the chunks into bins just 0·25dB wide. So giving resolution four times greater than before. The data re-compared the DTTV and iPlayer R3 versions of the ‘Fountains of Rome’ Prom performance. Looking at the plots two things are now quite clear. The iPlayer version is, overall, about 6dB louder. And the iPlayer version now clearly shows a ‘spike’ at the high-power end of the distribution that is absent from the DTTV version.
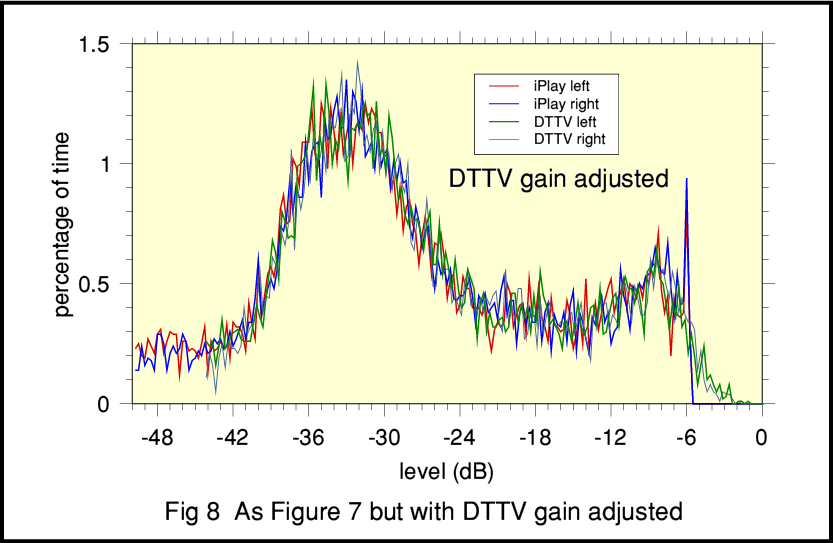
To make comparison easier we can use Figure 8. It displays the same results as Figure 7, but I have slid the DTTV distributions across the graph by about 6dB to bring the bulk of the DTTV and iPlayer shapes into alignment. We can now see that they are essentially similar with just one obvious exception. The DTTV distribution now extends about 4 or 5 dB above the spike at the upper end of the iPlayer distribution. This is clear evidence that the iPlayer sounds were being limited at about -5dB.
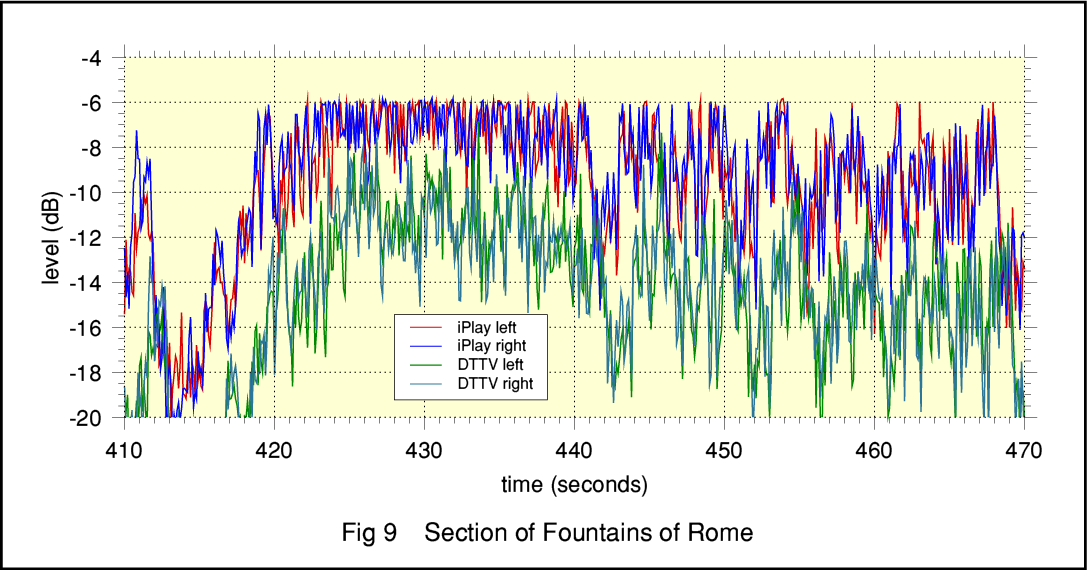
The difference can also be seen if we zoom in and just look in detail at one of the loudest sections of the music. This is shown in Figure 9. Looking at this, my first reaction was that the iPlayer sounds were being limited at -6dBFS. This could be explained by the 16 bit samples having their most significant bit suppressed or lost. However close examination of the data showed the problem tended to be at around -5.6dBFS, and that the precise level varied from one broadcast to another.
At this point I became curious regarding the choice of the replay level the user can set with a vertical ’volume control’ slider provided by the Flash web browser plugin. By default I was always using this at maximum setting – ‘11’ – as previous experiments and info from the BBC had told me this corresponded to 0dB gain and should minimise any problems due to rescaling of values. But I now wondered, what would happen if I changed the replay level to ‘5’ and thus turned down the iPlayer replay gain by about 6dB?
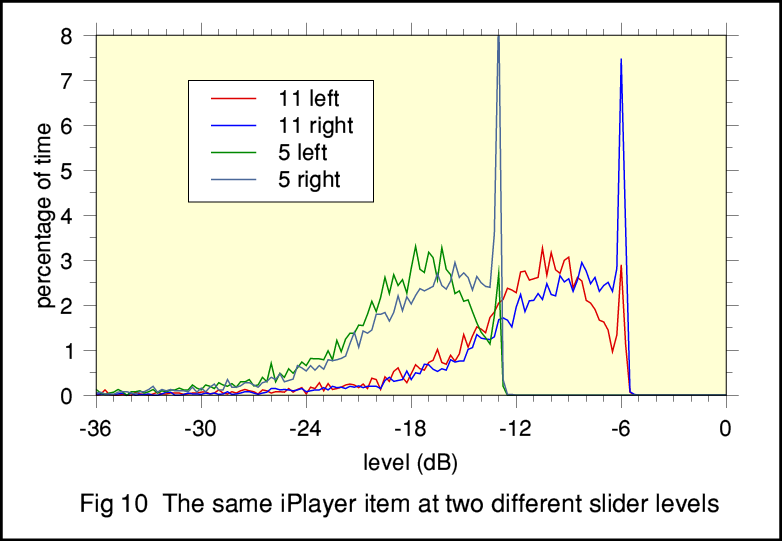
To test this I recorded the first 10 mins or so of a performance of Gershwin’s “Let them eat cake” that was broadcast on Radio 3. I actually did this four times. Figure 10 shows the results for two of the recordings. In one case I had the iPlayer replay gain at ‘11’, and in the other I had reduced it to ‘5’. (BTW I have been told that having ‘11’ as the maximum is a reference to ‘Spinal Tap’!) Looking at Figure 10 we can see that reducing the replay level does not cure the limiting effect. The spike at the maximum level end of the distribution remains. All we do is wind down the overall volume.
At this point I started to wonder if something else was wrong with the computer system I was using. So I tried two other measurements to check. One was to use a totally different machine (a new laptop) and made a recording with that of the Gershwin. It gave the same results as you see in Figure 10. I then used my main computer system and recorded 10 mins of a BBC1 TV programme. For this I chose the beginning of the first ‘Antiques Roadshow’ of the new series.
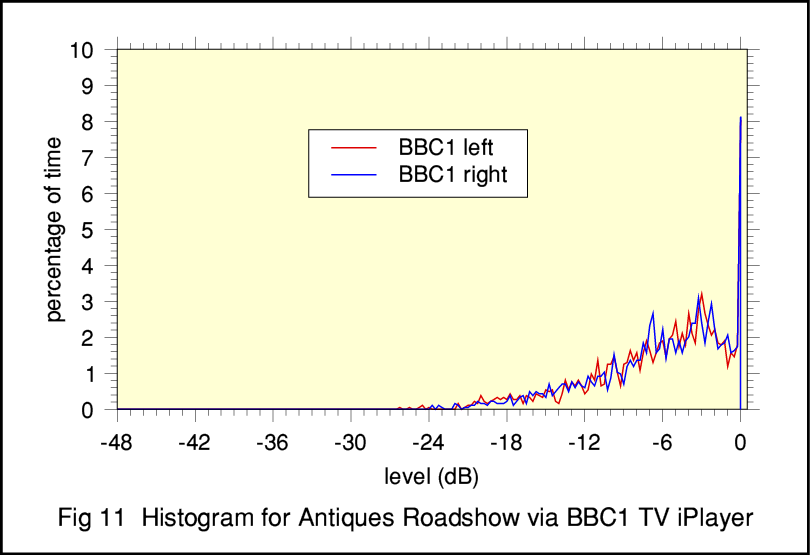
Figure 11 shows the results from the BBC1 TV recording with the iPlayer replay gain back at ‘11’. You can clearly see that this distribution has no problem rising above -5dB! That helped confirm that the limit isn’t somewhere in the computer hardware I am using. Although the results do show that the producers of the Antiques Roadshow are quite happy to have their sound repeatedly limiting up in the region between -0.2dBFS and 0dBFS.
I had been discussing my results with people at the BBC and they confirmed that the Flash code they download as a plugin is responsible for converting the AAC/AAC+ into LPCM as well as unpacking the Flash wrapper and scaling the volume of the output. Hence the evidence does point firmly at the chain before the LPCM is fed out of the Flash plugin to the rest of the listener’s computer. The evidence clearly established that the limiting effect on the BBC radio iPlayer was real, and stemmed from something beyond the listener’s control.
The above said, I should also make two other points to put the matter in context. The first point is that many of the R3 iPlayer broadcasts I have examined show no sign of the above limiting. So it isn’t universal that all programmes have been affected. The real puzzle is why it happens around -5dBFS rather than allowing the peaks to reach up towards 0dBFS. The second point is not to take too seriously the ‘percentage’ values shown on the vertical scales of the distributions when looking at the ‘spike’ at the high end of the distributions.
This is because the values shown are ‘percentage of the 100 msec chunks that contain at least one sample that reach a given maximum level’. The approach of considering peak level during each short time period is convenient as a way of giving an overall impression of the audible dynamics. But the resulting distributions are not the same as those for the individual LPCM samples. For 44,100 sample/sec LPCM data as used for the iPlayer each 100 msec chunk will contain 4,410 samples in each channel. It is quite possible that only a few (perhaps just one!) samples in a given chunk are affected. So the percentage of the time for which the actual LPCM is affected may be much less than the value shown on the plots.
For the sake of illustrating the significance of this distinction, let’s assume for a moment that each 100 msec chunk that shows a value in the limiting ‘spike’ actually only had one sample that was being affected. That would mean only 1 out of the 4410 samples in each chunk had been limited. A ‘1 percent’ value for the chunks would then mean that just 1/4410 = 0·0002 percent of the samples in the data were being changed! So the actual amount of sound data being modified would be far less than you might think from the plots. The ‘spikes’ above -6dBFS do show that limiting is occurring, but they don’t establish how serious the effect may be. What was significant for me was that I didn’t notice any audible limiting when I was listening, even having discovered by measurement that limiting was occurring.
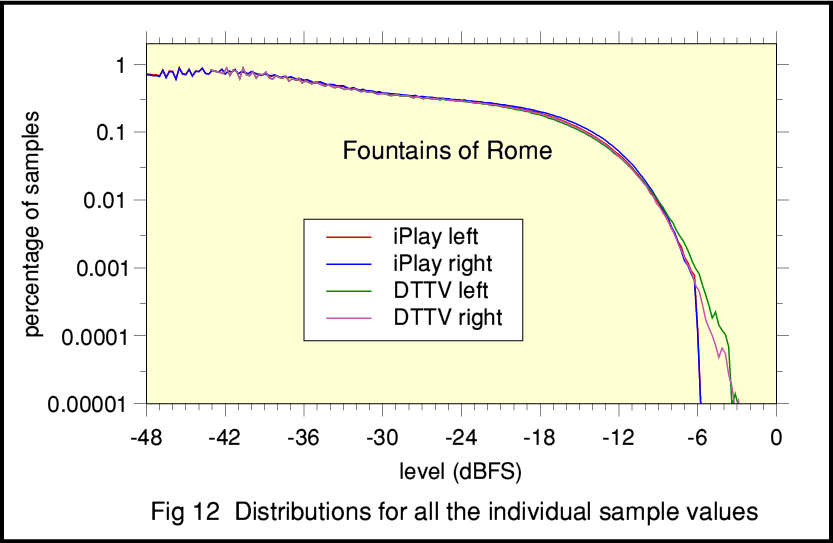
To assess this I re-analysed the Fountains of Rome example to produce the results shown in Figure 12. This differs from the other distributions in one critical respect. In this case I counted up the total number of individual sample values that fell in each 0·25dB range. So this plot is for all the individual samples, not ‘per 100 msec chunk’. The result therefore avoids the problem I describe above which can tend to make limiting appear more common than in reality. Note that this graph uses a log scale for the vertical axis to make the details for rarely occurring sample values easier to see.
In fact, Figure 12 shows that the number of samples affected by the iPlayer limiting is far less than 1 percent of the total. For comparison I have gain-adjusted the DTTV plots to align the bulk of the distributions. As with the other plots there is still an obvious difference once we reach the region just above -6dBFS. In this case the iPlayer distributions abruptly fall away as the limiting is reducing the values of samples that would otherwise be above -6dBFS. But the number of samples affected can be seen to be less than about 0·001% of the total. This indicates that when we see a ‘spike’ up to about 1% in a plot like Figure 7 or 8 then – on average – no more than about 5 samples are being affected by each limiting event. For around 99.999% of the time the sample values are not being limited. i.e. Almost all of the sound data is unaffected. This explains why the effect seems effectively inaudible in practice. It remains clear that some limiting is occurring, and in principle it would be much better if this wasn’t happening, but the effect does almost no harm to the audible results.
Whilst I was obtaining these results I discussed them with some BBC contacts who were very helpful. After some investigations they informed me that the limiting was being applied to avoid some other possible problems that might otherwise occur. One contact at the BBC explained:
“Safety limiting is applied to avoid any issues with encoder or DAC overshoots. These overshoots are generic and not specific to Coyopa. It's a deliberate design decision and not any kind of 'workround': by ensuring that no unexpectedly high peaks go through we are introducing a controlled, known level. By then allowing headroom for the known worst case combination of encoder and DAC overshoot we ensure that the output from Coyopa will not be distorted due to current or future codecs; or by any particular soundcard. Where I do fully agree with you is that the limiting must be transparent to the listener and have no audible effect on the signal or dynamic range. The exact threshold at which limiting is applied and the level of headroom that is allowed for overshoots are being reviewed and may change.”
I was also told that in general program material the overshoots could reach up to 2-3dB, but that much higher values had been seen with some specific waveforms, so they were being careful.
Clearly, in an ideal world limiting should never occur. But from the above results I am personally fairly happy that the limiting my measurements revealed is in practice essentially inaudible. Although I remain curious about its detailed cause and also the cause of the rise in HF floor and the 15-16kHz roll away I examined on the previous page reporting my measured results.
Finally, I decided it was worth checking one more point. This was to see what differences there might be between the ‘live’ and ‘listen again’ versions of a programme from the iPlayer.
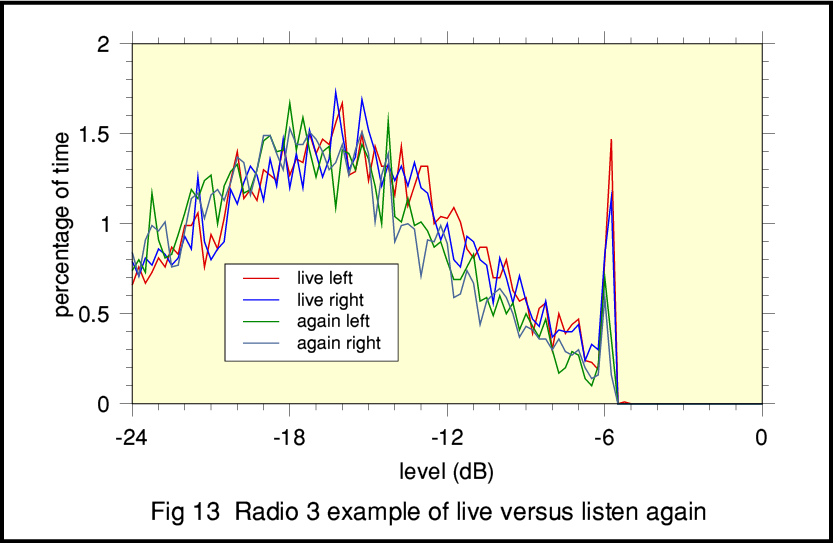
The above shows the dynamics for a 15 min Radio 3 item on an ‘amateur’ piano festival, first broadcast on 17th September. Both live and listen again versions are shown. They display much the same limiting spike at just over -6dBFS. However if you look carefully you can see that overall the ‘live’ version was 2-3dB louder than the ‘listen again’.
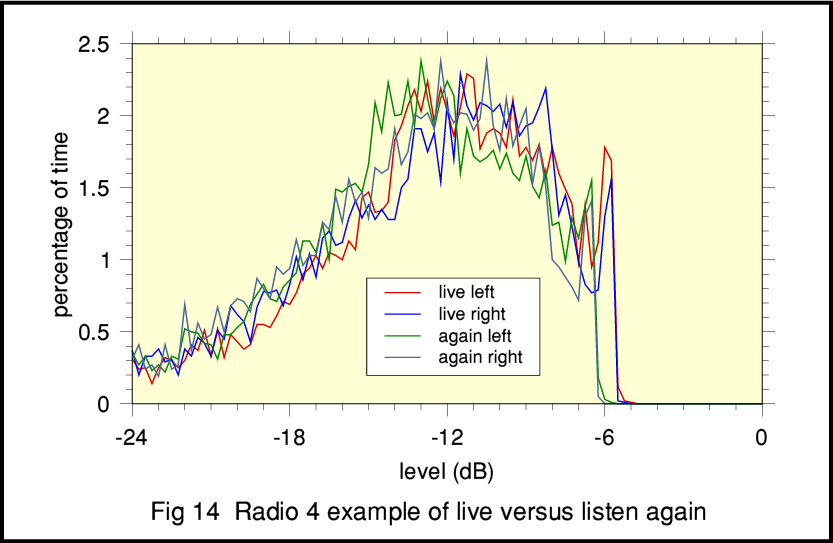
Figure 14 shows a similar comparison, this time for part of a Radio 4 programme in the Natural World series, again initially broadcast on 17th September. As with the R3 example, you can see that the ‘live’ iPlayer version was a few dB louder than the ‘listen again’ version. However in this case the limiting spike has also been shifted upwards by a dB or so.
Figures 13 and 14 are examples of what seems to be general behaviour. Overall the live and listen again versions of programmes from the BBC iPlayer are very similar. But they may differ by up to a few dB in level, and the limiting spike may change slightly. This all confirms what I have been told by the BBC; that the versions are encoded separately, so may differ. There is no sign that one version is having more level-compression applied than the other. And the limiting seems to have little or no audible effect. So in practice the main audible difference should be that one version may be slightly louder.
In addition to the slight peak limiting the Radio iPlayer measurements do show that it tends to exhibit a low-pass bandwidth roll away at around 15 kHz, and there is a curious rise in HF noise when the sound modulation level is high. To set against that the AAC encoding system used for the iPlayer is nominally more modern and capable than the older MP2 encoding used for DTTV. So on that basis you might expect the iPlayer at 192 kbps for Radio 3 to pack in more musical detail than DTTV. Whereas the DTTV audio is based on 48ksamples/sec whilst the iPlayer only works at 44.1ksamples/sec. Given the lack of the 15kHz roll away on DTTV you can argue that the DTTV delivers a wider audio bandwidth. So from a technical point of view, for live listening you can make arguments either way for which method – DTTV or iPlayer – is preferred.
In general, though, I find I am happy to enjoy either, but with a slight preference for the iPlayer. And of course the iPlayer wins hands down when it comes to ‘listen again’ which I find very useful. So in practice I tend to listen to both, choosing simply on the basis of whichever happens to be convenient. Either way, the results sound very good to me, and avoid the level compression, background noise, multipath distortion, etc, that afflict FM listening. The main snag is that you may have to take care to ensure the computer setup you use for iPlayer listening is working correctly. This isn’t as easy to establish as it might be. But hi fi enthusiasts are accustomed to having to spend time and care on checking that their listening equipment is working well if they want good results!
Jim Lesurf
2300 Words
5th Oct 2009