During recent years I have tended to prefer listening to BBC R3 via DTTV (Digital Terrestrial TV) rather than via FM or DAB. During 2006 to 2007 I did some measurements and analysed the results to compare the dynamic range, etc, on DTTV (and DAB) with FM. These comparisons showed quite clearly that that R3 on FM was distinctly level-compressed and had a higher background noise level than on DTTV.
However during the last few months the BBC have brought an improved version of their Radio iPlayer service into general use. This employs aac/aac+ encoding and uses 192kbps for R3, along with 128kbps for most of its other radio stations. Having setup a suitable computer system as a receiver I rapidly found I preferred the iPlayer to DTTV for BBC Radio listening. One big reason for this was the ability to ‘listen again’. But the sound quality also seems pretty good to me. So with the arrival of the 2009 ‘Proms’ I decided to revisit doing some comparisons of the dynamics, and this time to include the BBC iPlayer.
The BBC Prom Concerts have some useful features when it comes to doing an examination of broadcast dynamics, etc. The performances include music that has a wide range of levels and tonal features. The broadcasts are also on BBC TV (mainly BBC4 but also 1 and 2) as well as being on Radio 3. Hence they are a chance to assess a series of ‘parallel’ versions of the same source performance. I therefore made a series of recordings to collect data for examination. Here I will focus on a specific example for the sake of illustration. This is a performance of Respighi’s The Fountains of Rome that was broadcast on 8th August 2009. (BBCSO conducted by Knussen.)
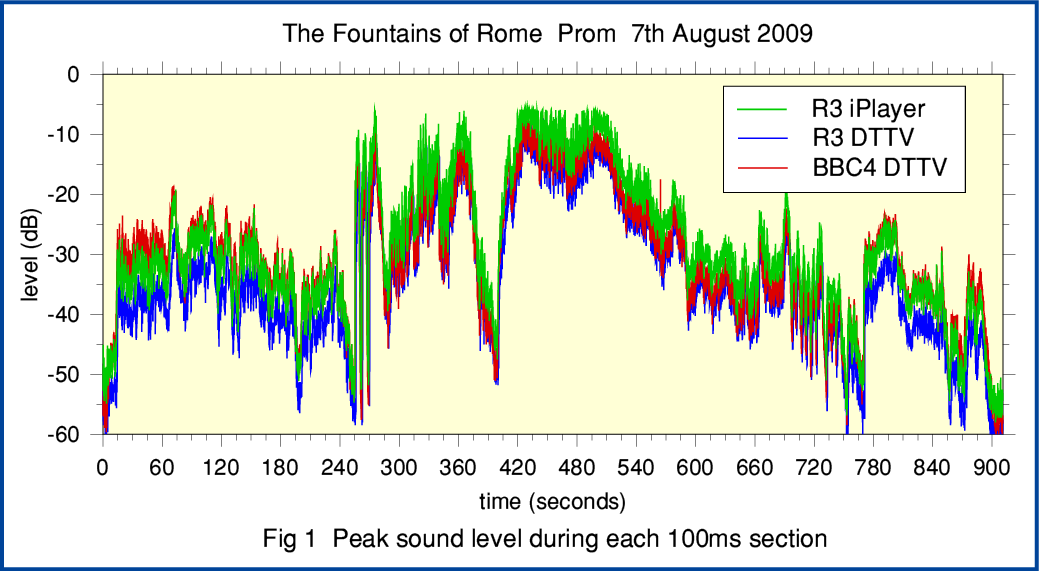
Figure 1 shows how the peak level varied with time during this performance. To obtain these results I divided each recording into a series of 100 ms chunks and found the peak level during each chunk. The vertical scale has a 0dB reference defined by each actual broadcast system. i.e. 0dB corresponds to the level which would just reach clipping for the LPCM in each case. Plots are shown for DTTV BBC4 TV, DTTV R3, and R3 via the iPlayer ‘Listen Again’ service.
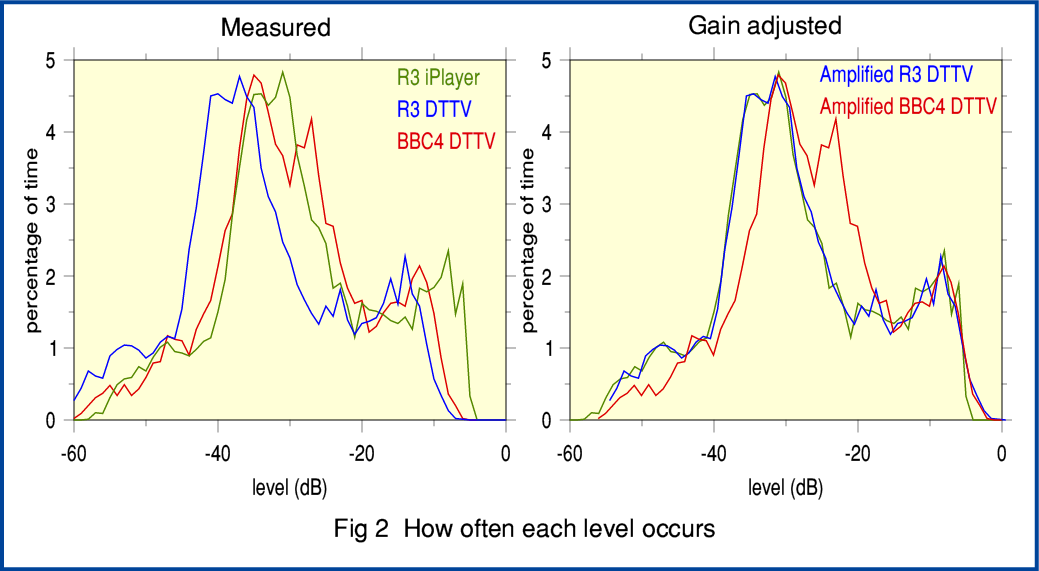
Figure 2 shows histogram plots of the peak level data. These indicate how often the peak level during each 100 ms chunk was at a given value. The analysis programs, etc, I used here are the same as for my comparisons in previous years and also as used for my previous examination of level compression on commercial CDs.
The histogram on the left in Figure 2 represents the raw results. However it seemed clear that there were some small differences in the overall gain applied during transmission. In particular, R3 via the iPlayer seemed to have been amplified slightly compared with the other methods. To assess this the histogram on the right of Figure 2 shows the effect of shifting the DTTV distributions to make their highest-level parts more in line with the iPlayer. Once this has been done you can see that the distributions for R3 via the iPlayer and DTTV are very similar. With one tiny feature excepted the results show the iPlayer and DTTV versions of R3 to have essentially identical dynamics within the accuracy of the analysis method. This means that the iPlayer version of R3 – just like the DTTV version – is unaffected by the significantly higher amount of level compression that tends to be applied to R3 on FM. So if you want to hear R3 with little or no level compression then the iPlayer and DTTV are both preferrable to FM.
The possible exception is that the iPlayer distribution seems to be slightly compressed over the upper few dBs of its range. In effect, for less than 1% of the time the signal seems to have had its gain briefly reduced by a dB or so to avoid clipping. But for over 99% of the time the dynamics of the iPlayer and DTTV versions seem much the same. I asked some contacts at the BBC about the above and they admitted that on occasion they may have had the gain level for the iPlayer slightly too high. That said, the above histograms only have a statistical resolution of 1dB, so the slight differences in the distributions may be due to the limited resolution of the analysis. I must say that I didn’t hear any brief level reductions when listening to the iPlayer version of the music. So either the effect is rare and slight, or didn’t actually occur. Thus far it is hard to tell from the results I have, although I hope to investigate this in more detail in the future.
When we compare the BBC4 TV broadcast version with the R3 version there is a much more obvious, and clearly systematic, difference in dynamics. Looking at the right-hand plots in Figure 2 shows clear signs that the BBC4 sound is being level adjusted to make quieter passages a bit louder.
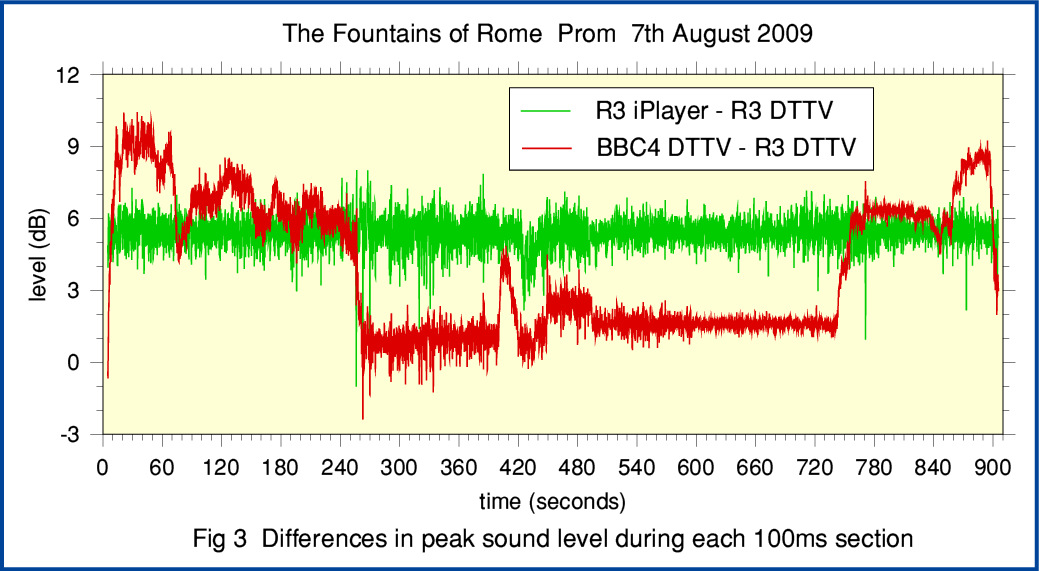
Figure 3 shows the results if we time-align the chunks and subtract the R3 DTTV level from the level of the iPlayer and BBC4. Note that this subtraction isn’t perfect for various reasons, so is subject to some analysis uncertainties. Hence the plots are quite fuzzy. But looking at the results one implication is fairly clear. The relative level for the BBC4 version does vary during the broadcast. During quiet passages of music at the start and end of the performance the BBC4 sound level approaches around 9dB higher than the R3 DTTV version. But during the louder passages this difference is wound down to just 1 or 2 dB.
The R3 iPlayer version seems to typically sit at about 5dB above the DTTV R3 level. But there is no real sign of any systematic alterations of the gain or level compression. Overall, the iPlayer has essentially the same dynamics as the DTTV version.
I generally found the level compression on BBC4 to be quite subtly and skillfully done. The results do compare favourably with most commercial CDs! So far as I can tell – apart from the possibility of an occasional brief drop to avoid clipping – neither of the versions via R3 show any signs of systematic or automated level compression.
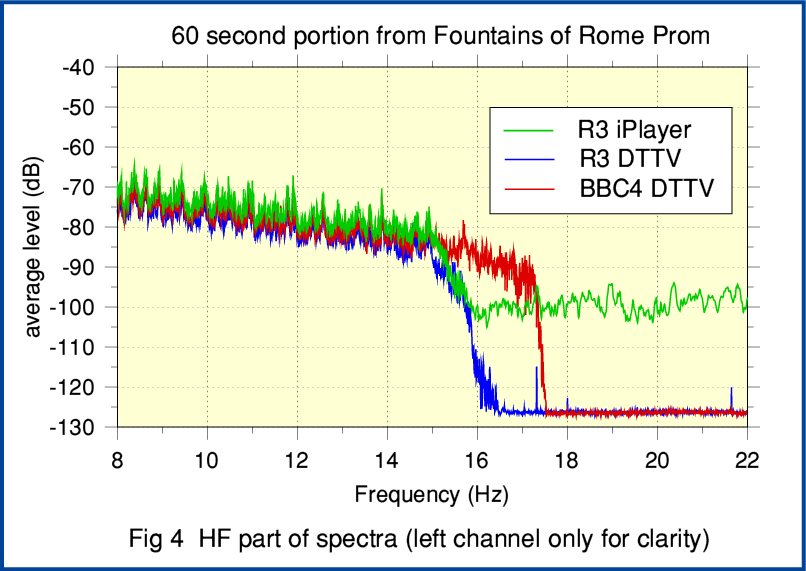
Having examined the dynamics of the ‘Fountains’ Prom I decided to also look at the spectral distributions and see if there were any obvious differences between the versions. To do this I chose the portion of the performance between 420 and 480 seconds in Figures 1 and 3. I then did a 60-second power-average over a series of 8k FFTs covering this portion. Comparing the plots over the entire 10Hz - 22 kHz band showed that they were almost the same except for the expected overall difference in gain/level. However when I looked in detail some curious features showed up at the high frequency end of the spectra.
Figure 4 illustrates the differences. For clarity this shows the range between 8 and 22 kHz, and just displays the left-hand channel spectra. (The right channel results are much the same.) The spectra below 8 kHz don’t show any obvious differences between the versions of the broadcast.
Two features are fairly clear.
- Firstly, it can be seen that the R3 versions (both iPlayer and DTTV) show a fairly abrupt cut-off between 15 and 16 kHz. Whereas the BBC4 version extends up to about 17 kHz before being cut off.
- Secondly, above the cut offs the DTTV versions show a ‘noise floor’ of around -126dBFS whereas the iPlayer version shows a higher floor of -100dBFS
Given the nature of the lossy codecs involved it isn’t surprising that the signal level might cut off somewhere at HF. This is because as we go to higher frequencies we can expect the ‘hearing threashold’ level to rise. So the encoder will tend to discard HF components as being ‘too quiet to be audible’. Someone at the BBC I discussed this with commented that “[The spectrum] starts tailing off somewhere between 16 and 17kHz - a higher cutoff than FM radio... Encoding very high frequencies with a limited bitrate is not necessarily a good thing, as fewer bits are left to accurately encode those frequencies to which the ear is more sensitive.”. This does make sense to me. Since the average signal levels are below -80dBFS at frequencies over 15 kHz it seems unlikely that their loss will have much – if any! – audible effect. So it probably is better to allocate bits to providing a more accurate representation of lower frequency components.
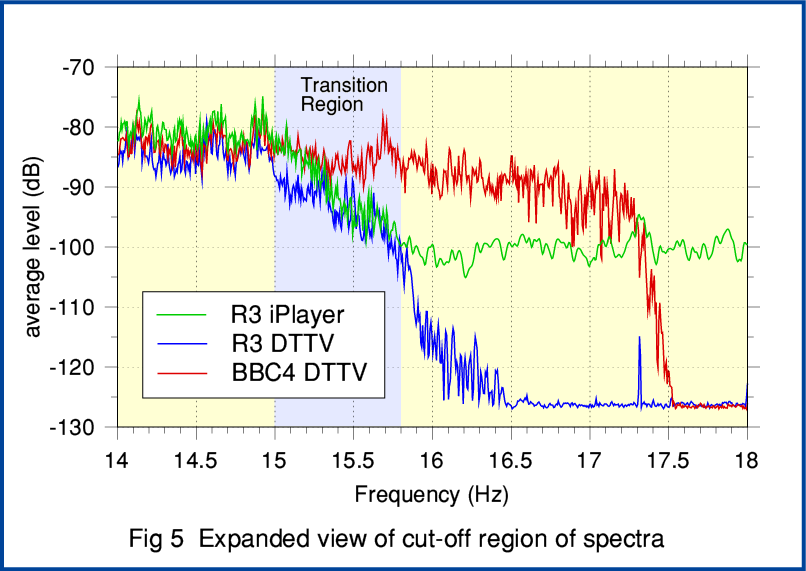
However looking at the shapes of the spectra shown in Figure 4 I’m not sure that is the entire story. To see why, we can have a look at Figure 5.
Figure 5 shows the same specra as Figure 4. But this time I have ‘zoomed in’ to only show the region around 16 kHz. Up to 15kHz all three versions have much the same spectrum shape. However if you look at the shapes of the R3 iPlayer and DTTV spectra you can see that they both show much the same fall of around 20dB as we go from 15kHz to about 15·8kHz. I have highlighted this as a ‘transition region’ in Figure 5 to make the behaviour clearer. The BBC4 spectrum does not show the same fall-away in this region.
Now this brings to mind that Stereo FM is limited to a nominal audio bandwidth of about 15 kHz. So audio signals destined for FM transmission need to be filtered with a low-pass cutoff to ensure very little audio gets to the FM stereo encoder above about 15kHz.
The interesting point here is that the iPlayer version of R3 uses a different codec and sampling rate to the DTTV version. (Note I am referring here to the sampling rates – 44,100 samples/sec for the iPlayer and 48,000 samples/sec for DTTV. I’m not referring to the bitrates of the encoded streams.) Yet despite these differences, both versions of R3 cut off in much the same way in the transition region. The only obvious difference being that above this region the iPlayer hits an apparent floor at -100dBFS whereas the DTTV falls to -126dBFS. In theory you might expect DTTV to be able to extend to 24 kHz and the iPlayer to 22kHz. But in practice for both R3 signals we seem to get much the same audio bandwidth as on FM. This does make me wonder if the R3 audio is being low-pass filtered to a 15 kHz bandwidth before it is presented to both the DTTV and iPlayer encoders. In effect, the same filtering that is appropriate for FM seems to be being applied to the signals for the digital media. Above 16kHz the behaviours are different, but it is hard to say more since there may be other differences that are lost below the iPlayer HF noise level.
The above spectra were based on using a series of 8192 point FFTs which generate spectra divided into 4096 frequency bands. Hence any background noise that has its power spread uniformly across the spectrum will be divided up across these bands. As a consequence, for such uniform noise the ‘noise floor’ produced would be a factor of 4096 lower than the total noise power – i.e. a factor of about 36dB. The DTTV spectra show an HF ‘noise floor’ of around -126dBFS. So if this were due to such noise it would be equivalent to an overall background noise level of -90dBFS. This is typical of the kind of level we might expect for correctly dithered 16 bit per sample LPCM. Hence the apparent HF noise above 16kHz for the DTTV examples is consistent with dithering of 16 bit sample digital data.
However the HF noise floor level for the iPlayer spectrum shown in Figure 4 is at a somewhat higher level, around -100dBFS. That may seem very low, but if it is due to noise or dither spread uniformly across the spectrum it would correspond to a total noise level of just -64dBFS. This is much higher than we would expect for 16 bit samples dithered with a ‘white’ spectrum. For LPCM it would be more like what we’d expect with 10 or 11 bit samples! To investigate this I did some more spectra, looking at other portions of the Fountains of Rome example.
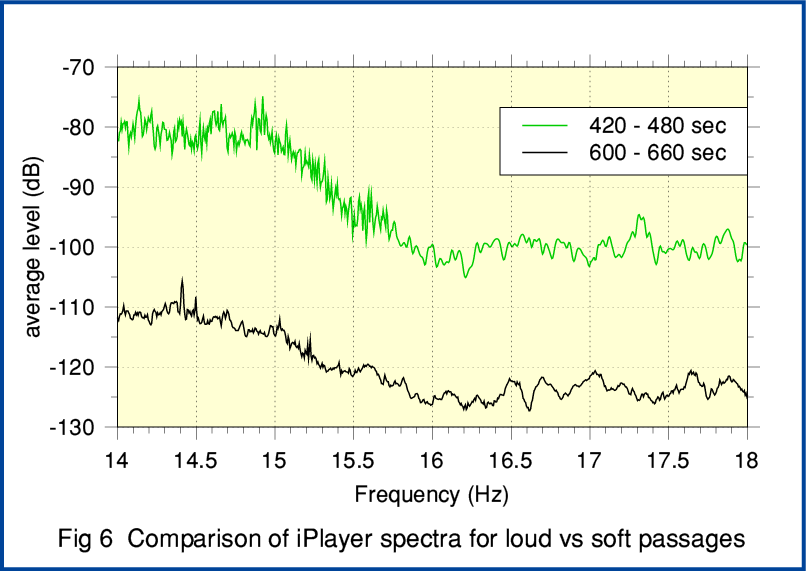
Figure 6 shows an example of the results. In fact this shows two spectra for the sake of comparison. One is, once again, the spectrum for the iPlayer result as in earlier figures. This was obtained from the section between 420 and 480 seconds from the start of the piece. If you look again at Figure 1 you can see this represents a fairly sustained loud portion of the music. The other spectrum (shown in black) is taken from the portion from 600 to 660 seconds from the start. This passage of music is around 30dB lower in level than the other. The result is quite interesting as it shows that the apparent ‘noise floor’ above 16 kHz has fallen to below -120dBFS.
So although the iPlayer output had a relatively high HF ‘noise floor’ when the music is very loud, that floor tends to reduce with the loudness of the music. Hence for much of the time it isn’t actually much different to the DTTV HF ‘noise floor’. It only rises when the music is loud when the music itself can be expected to mask the HF ‘noise’. At present I do not know why this effect occurred, but it may be an artifact of the aac/aac+ system being used. I may well come back to this topic in future when I have other evidence.
All the above said, it is worth emphasising that the effects I am observing above are all at frequencies around or above 15kHz, and at levels below -80dBFS. So it is doubtful if they would be audible. I haven’t as yet noticed them when listening. And of course, if you wanted to compare with FM you could always pass the output from DTTV or iPlayer though a 15kHz low-pass filter of the same kind that is always used for FM transmission and reception. That would then suppress the HF differences and prevent them appearing at the output! But they are of interest as possible symptoms that can be used to diagnose the inner workings of the transmission systems being compared. And there is the possibility that the variations in HF ‘noise floor’ do signify variations in ‘noise’ at lower frequencies which pass unnoticed in the spectra.
As I was intrigued by the above results I did contact one or two people at the BBC and asked for any comments. Their response has been very positive and helpful. As a result they are I are continuing to investigate. All being well, I will report further in the future, and expand on the results I describe here.
Curiously, for many years BBC FM broadcasts used the NICAM system to send the audio to their FM transmitters. And BBC analogue TV has used NICAM for providing good quality stereo sound to accompany the PAL TV broadcasts. This uses a 32 ksample/sec sampling rate so is band limited to around 15-16 kHz. It also uses just 10 or 11 bits per sample, scaled in blocks to cover a wider dynamic range. As a consequence, NICAM does exhibit similar behaviours to the above because the required dither (‘noise’) level has to scale up and down with the loudness of the audio. Yet I don’t recall many FM (or TV) audio enthusiasts saying they were unhappy with these effects showing up on FM or TV!
Having written the above I continued to investigate the behaviour of the BBC iPlayer. More results and some new findings can found by clicking here or on the ‘next’ button below.
2600 Words
Jim Lesurf
23rd Sep 2009