I love listening to BBC Radio 3, and to the Proms in particular. The quality of the broadcasts is generally superb. In recent years we’ve been spoilt for choice over the way we can choose to listen. Last year I compared the BBC iPlayer with other ways to listen by investigating the dynamics and spectral response. This year I decided use the Proms to look at waveform accuracy. Having started collecting data for analysis, the comparisons suddenly became much more interesting when a contact at the BBC told me they would be providing an experimental 320kb/sec aac stream. This made the question, “How much were the audio waveforms being altered in transmission?” even more intriguing. Was 320k measurably better than the standard stream? What I discovered surprised me. It was like becoming involved with Dr Who. I found I was collecting evidence for Time Travel...
For my examination I decided to use a method based on a mathematical process called Cross Correlation. This lets you compare two patterns (e.g. series of sample values) and obtain a number that represents how similar they are. A cross-correlation value of ‘1’ means the shapes of the two waveforms or sequences of values are identical. A value close to ‘0’ means they have no similarities. One neat feature of the method is that it scales the overall sizes of what you compare. So if you were to compare a waveform pattern with a copy that had simply been amplified or scaled down you’d still get a calculated result of ‘1’ if the patterns were the same. This means that the choice of replay volume (gain) shouldn’t alter the results.
However with a complicated ever-changing pattern like two recordings of the ‘same’ music you need to take care to time-align them accurately if you wish to find the correct correlation. This can be difficult to achieve but it has a bonus. It means that as well as seeing how similar they are, you can discover any differences in the relative timing (or phase) behaviour between two versions. Of course, for this to be possible you do need two versions. So for the approach to work I also required some form of alternative recording to compare with the 320kb stream!
For my initial analysis I decided to concentrate on one particular Prom. This was the “1910 Last Night” given on the 5th of September. I chose this because it was a very long concert with a wider diversity of types of music than usual. I made a recording using the 320kb/sec iPlayer stream. For comparison I decided to try two approaches. One was to also make recordings of the same Prom via Freeview (Digital Terrestrial TV) using both the live Radio 3 broadcast and the later BBC4TV version. The other was to ask the BBC if they could let me have a ‘source’ file copy. I should like to thank the BBC as they were happy to provide me with source LPCM files, etc, and gave me some very useful information about the iPlayer system. This meant I was able to compare what I received with what they were feeding into their Coyopa iPlayer systems. They also provided me with some recordings they had made of their 192k and 320k streams to check against my own recordings. Their generous help allowed me to carry out a detailed ‘end to end’ examination of the iPlayer streams.
I expected different recordings to show some relative time offsets. This was for two reasons. The first is the obvious one – I didn’t press the relevant ‘start recording’ buttons for them all at exactly the same instant. The second is that I expected the transmission and processing delays would vary from one transmission route to another. So I wrote a computer program that examined in turn each successive 1-second chunk of one recording and scanned along another recording to find which 1-second chunk in that gave the best correlation. This allowed me to determine with an accuracy of 1 sample what the relative timing was between two recordings for that portion of the concert.
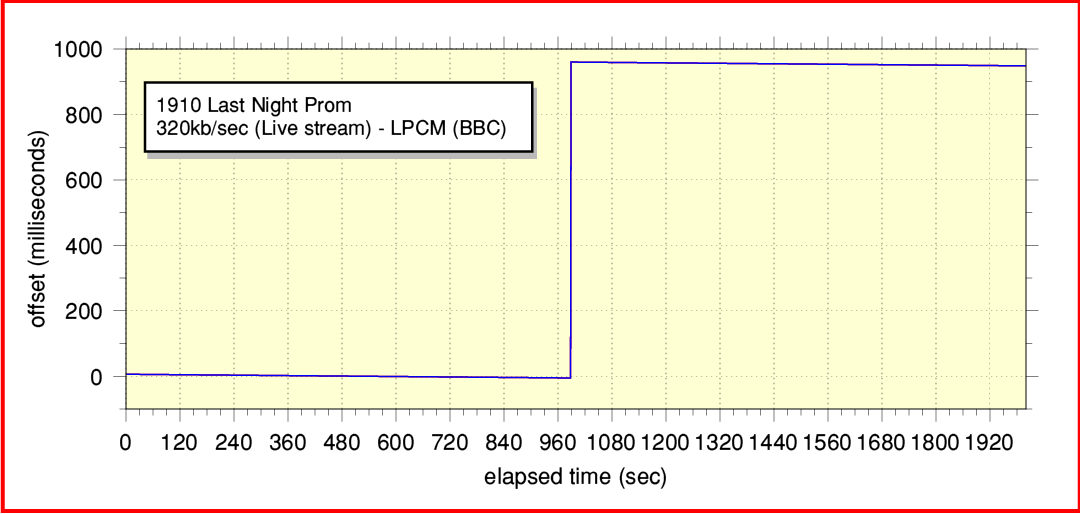
Figure 1 – 2000 seconds of ‘1910 Last Night’ Prom
Figure 1 shows the results of a correlation for part of the ‘1910 Last Night’ Prom. This displays the relative sample time alignment (converted into milliseconds) for each 1-second chunk during a section lasting just over half an hour. It compares my recording of the 320kb/sec iPlayer stream with the LPCM file of the Prom provided by the BBC.
The results aren’t what I expected! Firstly, there was a steady ‘drift’ in the relative timing. The effect is small – less than 1 sample per second – but it is quite clear. Effects like this are typical of systems where digital data is being transferred between devices that are using slightly different clock frequencies. The source and destination have agreed that the data is meant to be at a rate of 44100 samples/sec, but then fail to agree about how long ‘1 second’ may be! The consequence may be that the output has occasional repeated (or missed) samples because its clock is ticking at the wrong rate. The clock-rate error here is small – about 11·5 parts per million (just over 0·001%) – but it means that during 1000 seconds of concert around 500 samples are lost from the output.
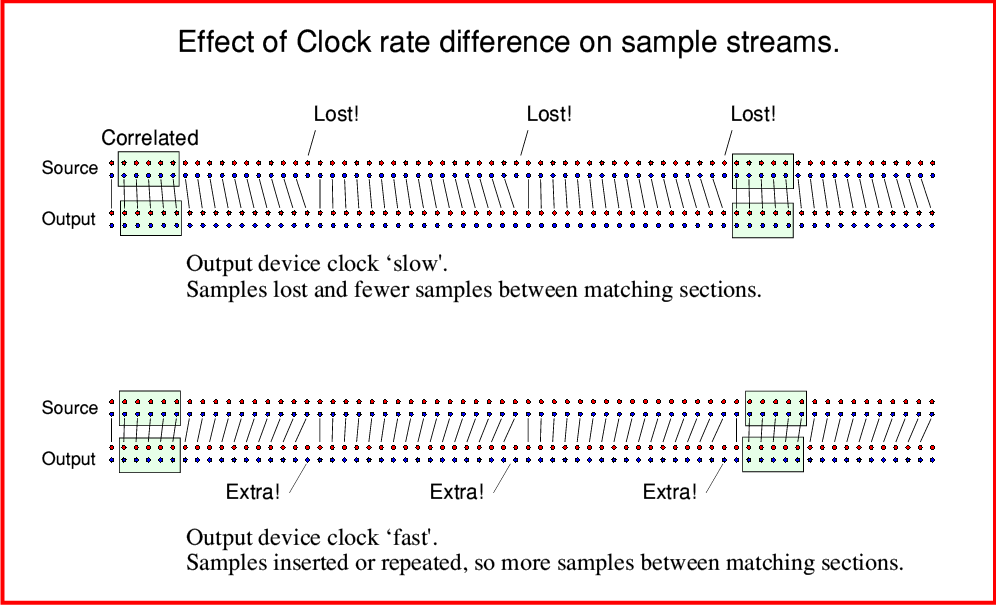
Figure 2 The effect of clock rate offset
Figure 2 illustrates the kind of effects that can arise if a device that is receiving data runs its own clock at a different rate to the source. If the receiver (i.e. home computer) has a ‘slow’ clock then some of the samples may simply be lost from the output. This can mean an occasional single left/right pair as shown, or less frequent bursts of successive samples. Similarly, if the receiver has a clock that is ‘fast’ it will be trying to output more samples per second than are being sent to it. It then may tend to create ‘extra’ samples and include them in the output. Either way, the receiver is trying to travel though time at a different rate to the source.
The change produced by the drift can be quite subtle, and so far as I could tell was inaudible to me when I listen to the Prom. But the second behaviour was obvious, and more puzzling. This is shown by the abrupt ‘jump’ of nearly a second in the relative timing about halfway along the graph in Figure 1. When listening I heard a silent ‘gap’ that lasted about a second. At the time I assumed this was because about one second’s worth of live audio stream had gone AWOL. However my analysis of the recording revealed something more curious. If I compare just before the gap and just after, the relative timing has changed abruptly by 0·995 seconds. After the audible gap the ‘live’ audio stream was arriving nearly one second later than before. And from then on it continued to do so – albeit with the steady time-drift still being applied by the clocking error. I used another program I’d written to scan the recording for any sequences of successive zero-values that occurred simultaneously on both stereo channels. And I found that the gap consisted of a burst of 50,794 zeros on each channel – i.e. a silence 1·151 seconds long. So about 0·15 sec of audio was lost, but the rest appeared later with the added delay. In effect the gap was mainly a ‘pause’, but with a small amount of loss of the audio.
The puzzle here is how a ‘live’ stream can behave in this way. Was the iPlayer now sending out the streams nearly a second later to everyone? Or was I for some reason now listening via an added 0·995 sec ‘delay’?
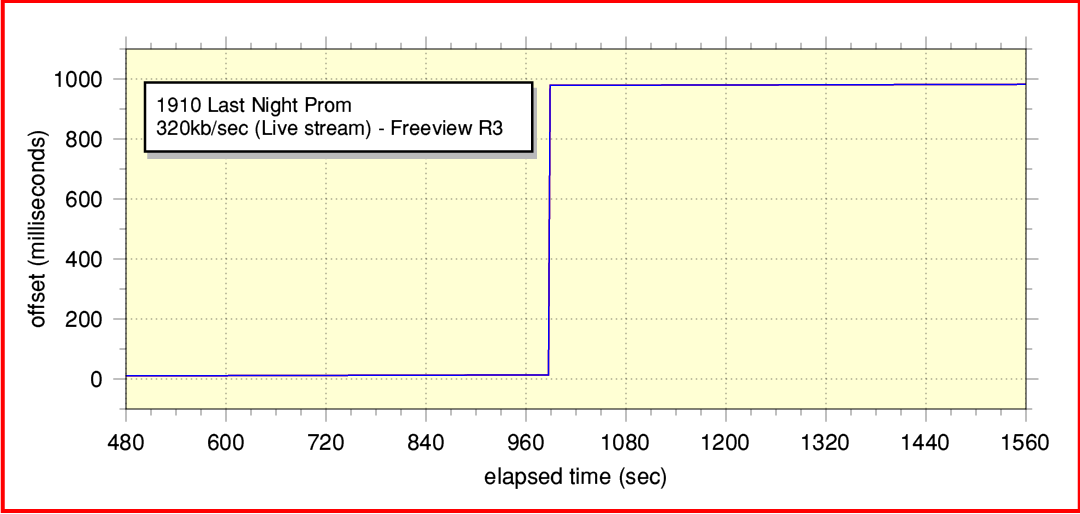
Figure 3 Comparison with Digital TV version.
To check this I also correlated my 320k stream recording against one I made from the live Radio 3 broadcast on Freeview. Figure 3 shows a part of the results, zoomed in to the section where the pause/gap occurred in the 320kb iPlayer stream. The first impression is that this is much the same as Figure 1. Once again you can see the same ‘pause’ where the iPlayer stream resumes with the sound arriving 995 milliseconds later than just before the gap. And either side of the pause we get a tiny clock phase drift of less than 1 sample/sec. (Actually 0·25 samples/sec, equivalent to a clock difference of 5·7 ppm.) However there is one subtle distinction. The drift shown in this comparison has the opposite sign to before. This means that the Freeview recording I made also has its own small clock phase drift compared with the BBC-supplied source version. The result implies that either there is a time drift between the (live) DVB-T Freeview and (live) iPlayer versions, or my actual recording processes had their own clock rate differences.
To record the Freeview and iPlayer in parallel I had to use two different recorders/systems running at the same time. For the 320kb iPlayer stream I used a laptop feeding optical spdif to a Pioneer CDRW audio recorder. For Freeview I used a Panasonic DVD recorder feeding a Tascam HD P2 recorder. This went via a DAC Magic to convert optical spdif into coaxial – and to let me listen. Since Freeview uses a 48k sample rate, I then used software[1] to convert this into the same sample rate as the iPlayer for the comparison.
The Pioneer recorder should lock onto the incoming spdif. But I’d let the Tascam record using sampling controlled by its own internal clock. Hence any frequency difference between the Tascam’s internal clock and the Freeview signal would show up as a drift in relative timings. Similarly, the laptop I used to record the 320kb stream has its own clock which might contribute drift to its output in some way. Hence it becomes difficult to tell where slow drifts in the time offset are coming from.
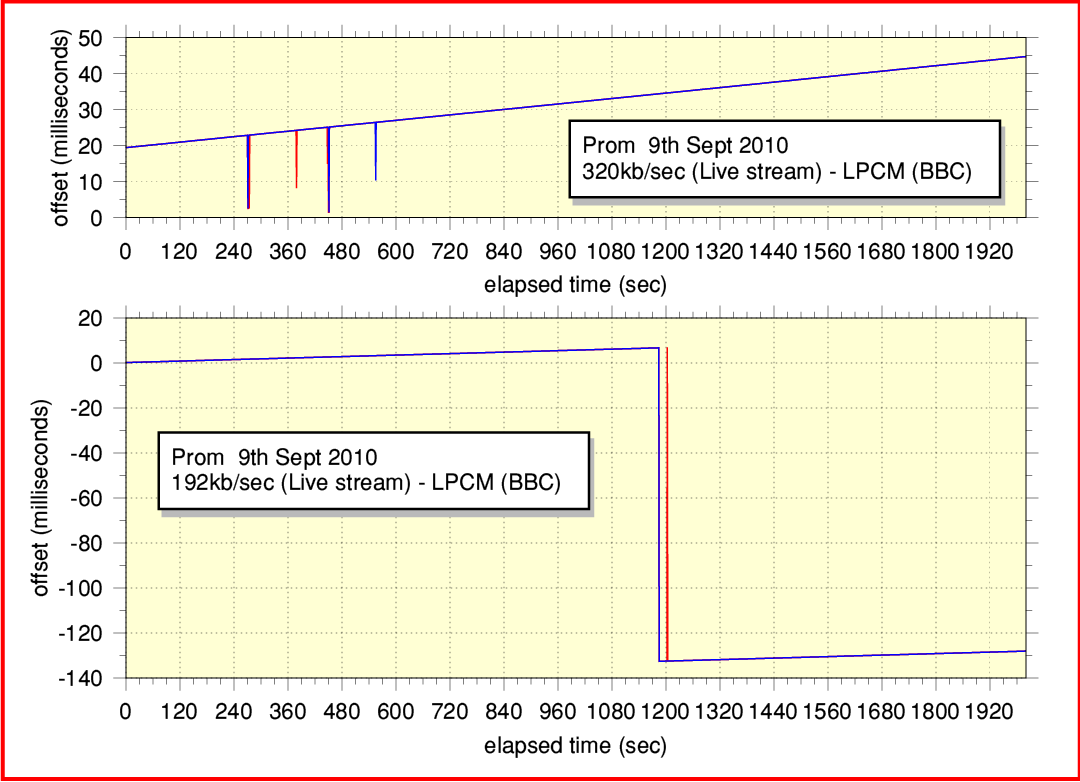
Figure 4 BBC’s own Live stream recordings compared with LPCM source.
Fortunately the BBC had also kindly send me copies of a source LPCM version of another Prom. With this they provided copies of recordings they’d made for themselves of the iPlayer output streams using a couple of computers at the BBC. So I decided to compare these to see if they also showed drifts or gaps or other effects. This Prom was the one performed on the 9th of September 2010. Figure 4 shows the timing behaviour for a 2000 second section near the start of the Performance.
Ideally, these plots would be expected to simply show a set of flat lines showing the same offset value at all elapsed times. However once again you can see drift, and abrupt jumps. As with my home recordings, the clock phase drifts are quite small. In this case just over 0·5 samples per second (12·6 ppm) for the 320k stream and 0·24 (5·5 ppm) for the 192k stream. The 192kb live stream recording shows an abrupt jump of over 100 milliseconds at one instant during the 2000 second duration examined.
It is hard to be sure about the cause(s) of these effects without knowing more about how the iPlayer Flash plugin works. Alas, a concern for me is that the plugin is ‘closed source’ software so I have no way to examine how it works and see if it can be tweaked or improved. Hence I can only speculate on what seems plausible. It does look like what I measure is result of the clock at the receiving computer (and/or recorder) generally running at a rate which doesn’t match exactly the rate at which the iPlayer is streaming out data. It may also be due to data not always arriving in time to be played. This implies that the software does not have a large enough input data storage area (buffer) for reliable 320kb/sec streaming. How this is affected by the plugin I don’t know.
Figure 5 Comparison with BBC4TV version
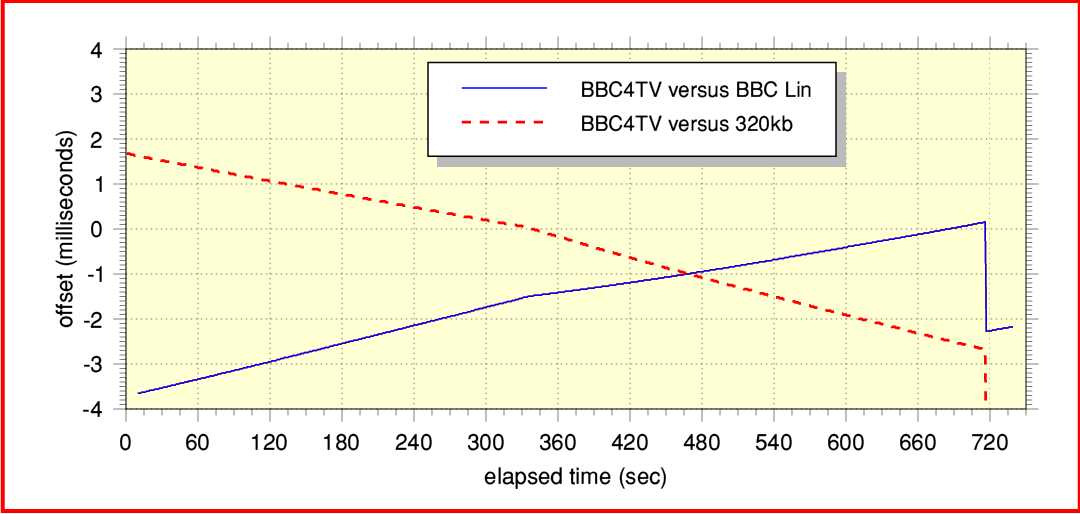
The 1910 Last Night concert was also rebroadcast at a later date on BBC4TV. So I decided to compare that with the Radio 3 versions. Figure 4 shows the results I obtained when I compared a recording of this with the BBC-supplied LPCM source file and the 320kb stream I’d made of the live broadcast on Radio 3. It is worth bearing in mind that we should expect the BBC4TV version to differ from Radio 3 because it was an edited rebroadcast. But during the performed music you would expect the results to be similar. Indeed, since the BBC4TV recording I made was onto a DVD using a videorecorder you would expect the result to be locked to the time clock of the actual transmission.
Given the earlier results it isn’t a surprise that Figure 5 shows a drift in timing when the BBC4TV version is compared with my 320kb stream recording. That can simply be due to the clocking of my computer not being in perfect step. And the abrupt change after about 720 seconds is when the music (in this case the Vaughan Williams item) ends and the commentary begins. There are, however, two odd features of the results. One is that the DVD recording is not clock locked to the BBC-supplied LPCM ‘source’ version. This seems to imply that the feed into Coyopa wasn’t time-locked to the digital TV broadcast. The other puzzle is the ‘kink’ in the drift rates at around 345 seconds into the comparison. Here the clock rate of the BBC4TV recording suddenly changes by about 2 ppm. That makes me wonder if, when the TV version was edited, different sections were pasted together that either had different initial clock rates, or one was ’stretched to fit’ the allocated time for the broadcast!
Overall, the results could be explained in all kinds of weird ways. Maybe the clock phase drifts are due to Time Dilation as predicted by Einstein. i.e. that the Royal Albert Hall and Broadcasting House are whizzing around London at speeds that would qualify them as ‘fast jets’ for the RAF. If so, I hope the drivers of the Outside Broadcast vans are well trained and paid RAF flight pay for having to drive around, trying to keep up! Alternatively, maybe the results tell us the secret behind the reappearance of Dr Who on the BBC. Perhaps the BBC is now run by Time Lords who brought the doctor back as good PR! And Broadcasting House is actually a TARDIS whose stabilisation in time and space is slightly faulty, causing the clocks there to run at a different rate to the rest of the UK. Indeed, a black hole kernel hidden away at the Albert Hall might also be affecting the clocks there!
Attractive as the above theories may be, though, the most likely causes are the imperfections of typical home computers, and the lack of end-to-end clock rate locking of the audio chains. Poor clocks, and no easy way to ensure that the soundcard outputs samples at the same rate as they are delivered by an incoming net radio stream are a recipy for these problems. On that score, the best listeners can hope for is that they manage to choose a computer whose audio clock rate accurately matches the ones used by the iPlayers. Not easy given the lack of info on such matter from the people who make and sell home computers! Fortunately, my results do show that the clock drifts are generally pretty small. I can’t say I actually heard any effects due to them. Overall, the 320kb/sec iPlayer stream sounded excellent to me. But your experience may differ, depending on how fortunate you were when buying your computer.
In terms of listening to the 320kb stream the audible problem was the noticable pauses. These occurred with an unpredictable pattern, but typically occurred once or twice an hour with the 320kb/sec stream. As such there were an irritation when trying to enjoy the music. Data transmission via the internet is done by sending a series of ‘packets’ of information whilst the computers at each end talk to each other about what has arrived and what next to send. The communication delay can vary unpredictably from one packet to another. To cope with this, the receiving system has an input storage area (buffer) to ensure it can collect enough material to then play smoothly. The sending machine may also have a similar output buffer to give it time to do other tasks in between obeying requests for more output. However if there is an exceptionally long delay for some packets the home computer may find its buffer has emptied! The result then will be a silence whilst it tries to get more info, refill its buffer, and resume playing.
So the audible gaps lead me to think that the iPlayer arrangements at the time of the experiment weren’t really sufficient for reliable 320kb/sec streaming. Increased buffering in the iPlayer Flash plugin seemed desirable. That said, I should also point out that I am hundreds of miles from Broadcasting House, and live on the edge of a small town. So my broadband connection isn’t very fast. This makes me think that it may well be a good idea if the iPlayer plugin had a user-selectable level of input bufferring and protection against steam delays and ‘jitter’ in the times of arrival of data packets.
That said, the curio here is that way the gaps I heard behaved as pauses. This implies either that they occurred at the Coyopa server itself or were due to an increased delay somewhere along the way. Alas, once again I can’t examine the Flash plugin code, so can’t tell if it was responsible for this odd behaviour.
When I started this comparison I assumed that the relative timing was just something to quickly determine so I could move on to analysing the level of waveform similarity between the 320kb stream output and other versions (including the source). But it turned out to be a surprising and fascinating area in its own right. As a consequence I ended up looking at time behaviour in some detail. However I will now move on to looking at comparisons of the waveforms themselves on another webpage. So consider this a pause, not a gap...
3100 Words
Jim Lesurf
18th Oct 2010
[1] I used the Linux ‘sox’ software and the command options ‘rate -v -L 44100’ to do this. The result should be an accurate conversion with time-symmetry.
