Thermal effects of asymmetric waveforms
Another example of how waveform symmetry might affect performance is as a result of differential thermal effects. To illustrate this we can make use of a test waveform which can be defined as having the form
This consists of a series of harmonically related cosine components which all have the same amplitude, have their phases aligned so that all peak at  , and the total is normalised such that the peak size is unity. This means the waveform has an rms level of
  , and – in power terms – a peak/mean ratio of
  .
.
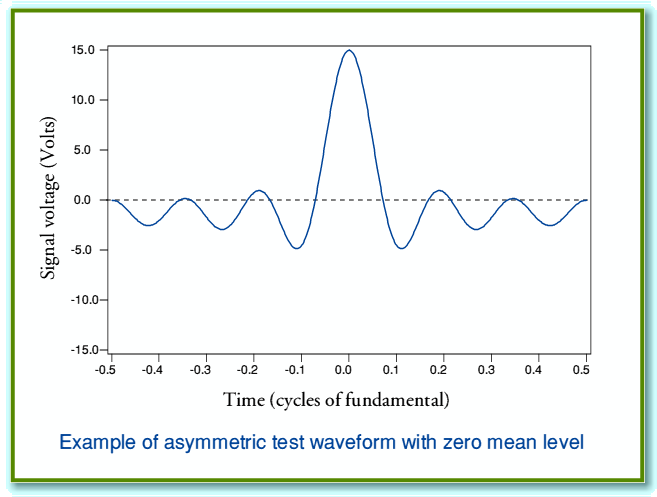
The graph below shows one cycle of the  waveform, with a peak amplitude scaled to 15 Volts.
The blue line shows the voltage pattern. The broken black line indicates the zero voltage level. It can be seen that the waveform spends more time at negative levels than at positive levels, but this is balanced out in terms of mean voltage by the high positive peak excursion. The waveform is periodic, but only one cycle is shown, and the time scale axis is indicated in terms of fractions of the period  .
.
Note that  is employed here purely for the sake of illustration. The higher the value of
  , the closer the waveform will approach being a periodic series of “spikes”.
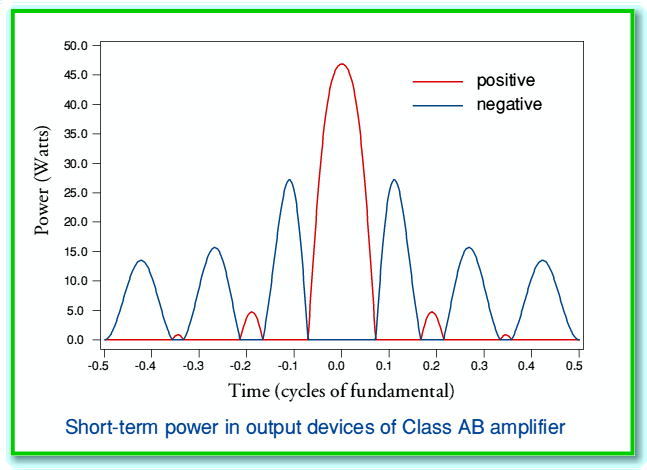
If we assume the above signal is applied by a Class AB amplifier to an 8 Ohm resistive load, and that the amplifier has fixed rail voltages of  Volts, then the resulting power dissipation patterns in the positive and negative output devices will be as shown in the following graph. As previously, we can assume the quiescent bias current level of the AB output is small enough to be ignored.
Here the red line indicates the power dissipation in the device which drives the positive sections of the output, and the blue line the dissipation in the device which drives the negative sections. It can be seen that the dissipation patterns differ. In general, therefore, we may expect the medium-term average power dissipations in the positive and negative devices to differ.
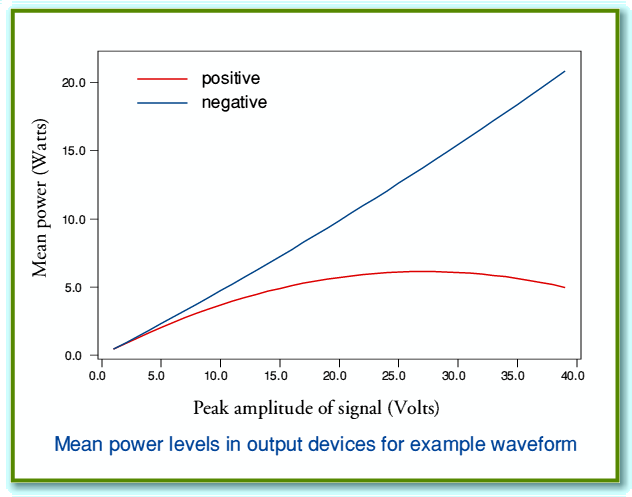
The graphs shown below indicate the mean power dissipations for a  signal as a function of the chosen peak signal amplitude. As above, 40 Volt power rails and an 8 Ohm load are assumed.
Note that as the peak signal size approaches the rail voltage the positive power level tends to fall. This occurs because the voltage across the positive output device is then small when the current is high, and vice-versa. Whereas the signal spends relatively long periods of time at a modest negative level, hence sustaining current through the negative devices whilst the voltage across them is high.
The example chosen here was selected purely for demonstration purposes. However the above shows that where musical waveforms are asymmetric we can expect differences in the thermal states of the positive and negative sections of a Class AB output stage. This may affect the biassing in a dynamic manner which is not revealed by the use of simple symmetric test waveforms like a single sinusoid. Hence there is some reason to consider the effects of suitable asymmetric test waveforms as they may expose amplifier problems which arise with music but which go un-noticed when conventional THD or IM measurements are carried out. Hence tests of this general type may be useful in identifying such differences between amplifiers that may appear with musical waveforms.
One curious by-product of the above is the following hypothesis: Some people claim they can clearly hear the “phase” of musical signals. (Strictly speaking, we should call this “polarity” or “sign” as the term “phase” is potentially ambiguous.) Others – myself included – have never been aware of hearing a change in the sound as a result of signal pattern inversion or sign. Such asymmetries might go some way to explaining this discrepency. It may be that some listeners are using an amplifier (or other items in the audio chain) whose distortion level depends upon the polarity of any signal pattern asymmetry. They may also be able to notice these changes. Hence they may detect a difference in the sound quality as a result of a change in polarity altering the details of the distortion. Others may not be sensitive to this effect, or be using equipment which is not sensitive to the sign of any waveform asymmetry. Hence they may not be encountering, or hear, such an effect.
At present I have no idea if the above hypothesis has any grounding in reality. However it would be interesting to see if asymmetry-related distortions could be related to such “absolute phase” awareness in listeners.
Test methods
Having introduced  , we can also define the related test waveform
This has the same mean power as  and the same power spectrum, but its phase spectrum is now such that the resulting waveform has symmetry. The value of its peak/mean ratio also differs from the value for
  .
.
In order to test an amplifier (or other unit) we can now envisage using these waveforms as follows:
Apply in turn, for suitable chosen values of  and
and  , the waveforms
  ,
,  , and
, and  . In each case record the resulting output and identify any components at harmonics of
  which are not included in the input signal. Identify any changes which arise as a result of the changes in waveform symmetry. Ideally, we would also check for any slight changes in the relative levels (or phases) of the components at frequencies which were included in the input. This then gives us some insight into the distortions which may arise with musical signals which are asymmetric, have a high peak/mean factor, and are essentially harmonic in their content.
An extension of the method is to choose to omit one (or more) of the components from the waveforms (e.g. the fundamental or some mid-harmonic) to see if this reveals a distortion created component whose details change with the input waveform symmetry. Since musical waveforms tend to have peak/mean ratios of the order of 10 or more, then a number of components may be desirable. However the optimum number remains to be determined by experiment. Similarly, the best choice of  may depend upon experimental details, but it should presumably be in the frequency range typical for the fundamentals of musical notes as played on musical instruments. For simplicity, when using a CD (or DVD-A) as a test signal source it may be advisible to chose
  such that each cycle/harmonic period occupies an integer number of samples, so as to avoid spurious sampling beating effects, and also be dithered with a pattern that does not repeat over many cycles to aid integration down to low noise/error floor levels.
In some cases in my experience the crosstalk that arises in stereo amplifiers has higher distortion/signal ratios than is present in the output on the ‘speaking’ channel. This might sometimes affect the perceived sound in complex ways, for example, altering the perception of the stereo image. The effect may go unnoticed during conventional single channel distortion measurements. Hence any test program should observe the output from both channels (or multiple channels in a Home Theatre system). It may also be useful to apply different signals of the forms considered here to both channels symultaneously. This may shed some light on interactions between channels when playing musical waveforms.
Many years ago I did do some realively simple tests using gated pulse generators on some amplifiers, and these lead me at the time to feel that tests of this kind were useful. However the test waveforms easily available then were relatively crude, and analysis of the results was difficult. Given modern equipment, generating and analysing the kinds of waveforms envisaged here should be relatively simple. I therefore think it would be worthwhile to carry out tests of this kind to see if it might provide results that might in some cases correlate with the differences people sometimes say they perceive when comparing one amplifier with another whilst listening to music. For this reason I have posted these pages. I invite people to consider and try out the test method I have outlined. I would be interested to discover the results.
Jim Lesurf
4th Jul 2003


