Amplifier currents and symmetry
The main problem in tackling this area is the sheer diversity and complexity of musical waveforms. With this in mind, we may end up feeling that the best test waveforms are, indeed, chunks of music. The “Lynx Effect” articles by Keith Howard in Hi Fi News magazine during 2003 are an example of the deliberate and considered use of musical patterns as a test waveform when probing for small changes due to any imperfections or alterations in the equipment under test. In principle, this method could be argued to be ideal. However in practice it suffers from some drawbacks. The main examples being:
- It becomes very difficult to disentangle various effects due to all sorts of linear and nonlinear imperfections or changes in the system under test.
- It becomes very difficult to make measurements with the required level of stability and repeatability to obtain reliable comparisons.
- The results may depend significantly upon the choice of music.
The test method Keith employed is an excellent one for some forms of “A/B” comparisons in order to detect changes, but for the above reasons it can be difficult to apply and interpret when we wish to focus upon understanding the specific topic considered here. To deal with these problems it might be better to adopt a test waveform that can be defined by a simpler method, but which still provides some of the main properties of typical musical waveforms. This would then permit a more systematic test routine, with results that would become easier to obtain, and easier to understand. The measured results might then be a better guide to actual performance in an audio system.
In general, musical waveforms often have the following medium-term and short-term properties:
- The frequencies involved tend to have a relatively simple harmonic (or near-harmonic) relationship.
- The amplitude tends to vary, with brief transient events appearing as well as a steadier level.
- The waveforms often show distinct asymmetries
- The form factor (peak to mean level ratio) tends to be somewhat higher than for a sinusoid, even during the body of a sustained note.
Some examples of the asymmetry of musical waveforms have already been considered in another page which can be found via this link or via the main Audio Misc page. Music is very variable, and hence not all musical waveforms show asymmetry. However many instruments exhibit asymmetric waveforms, so this is clearly a relevant factor at least in some cases. Given this, it is reasonable to consider how this might affect the behaviour of audio amplifiers.
It is a common observation in the audio world that “Class A” amplifiers often “sound better”. Similar claims are often made for valve (tube) amplifiers. There may be various reasons for these beliefs. However it also seems to be the case that some amplifiers that are neither Class A nor employ valves are also sometimes judged to “sound good’’. I can’t really comment here in general terms as to whether any of these claims are actually correct in any specific cases. However taking them at face value, we can form some hypotheses which might go some way towards explaining why such claims may sometimes be correct even when conventional distortion measurements show no obvious clues to related differences.
For the sake of illustration, lets consider the three power amplifier output topologies shown in the following diagrams. Note that, as drawn, none of the examples is intended as a practical design. The diagrams are simplified, but contain the essential topology for making the relevant points.
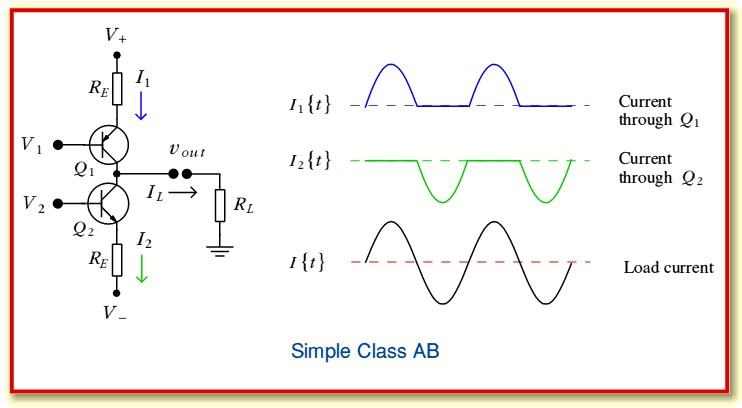
The diagram above shows a pair of transistors used as an output stage which I’ll assume is “Class AB” with negligable quiescent current.
With the “Class AB” example above we can see that the current profiles on the positive and negative power rails are essentially half-wave rectified portions of what passes through the load. As a result, these current waveforms (and any resulting voltage fluctuations of the rails) are quite different to the intended signal pattern. This means that if these rail fluctuations couple or influence the amplifier output they may well introduce distortion. Ideally, no such unwanted couplings will occur. However in some cases, when the signal waveforms are symmetric, the coupling contributions from the positive and negative rails might tend to cancel each other.
In other cases, small departures from symmetry may mean the distorted rail currents/voltages do inject some distortion, but this may combine with the effects of other distortion mechanisms. This leads to the possibility that we might in some cases end up ‘nulling’ the distortions injected from rail variations with other distortions. However this may only lead to a low overall resulting distortion with suitable waveforms. The consequence may be that – when testing with simple symmetric waveforms like a single sinewave – these various distortion contributions largely cancel, hiding the effects from detection. The consequence may be that there is a risk when developing or testing using simple symmetric waveforms that we get a low apparent non-linearity value, but when asymmetric waveforms are present, higher levels of overall distorion may arise.
At this point it may be useful for me to comment that when developing and testing power and integrated amplifiers myself I have often encountered situations where altering the looming (wiring layout) had a dramatic effect upon the measured THD values. This was particularly the case at high frequencies (approaching 20kHz) where radiation and inter-coupling would be more significant than at lower frequencies. Also more noticable at high powers. As a result of such experiences I think it likely that such effects do occur, and sometimes moving wires can reduce the total THD observed. However in itself, this does not establish what then occurs with other waveforms, where the distortion behaviour may vary in other ways.
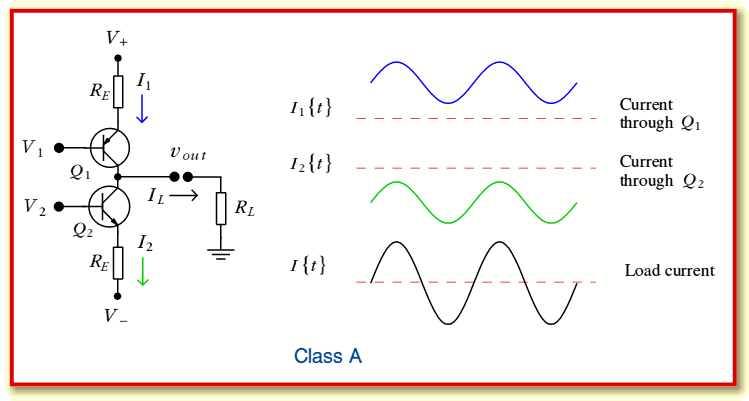
With the “Class A” example illustrated above, the rails currents are essentially the same in shape (except perhaps for inversion) as the signal itself. This means any rail injection or influence tends not to produce distortion. As a result, nulling or combination of this with other mechanisms should have little effect upon the overall distortion.
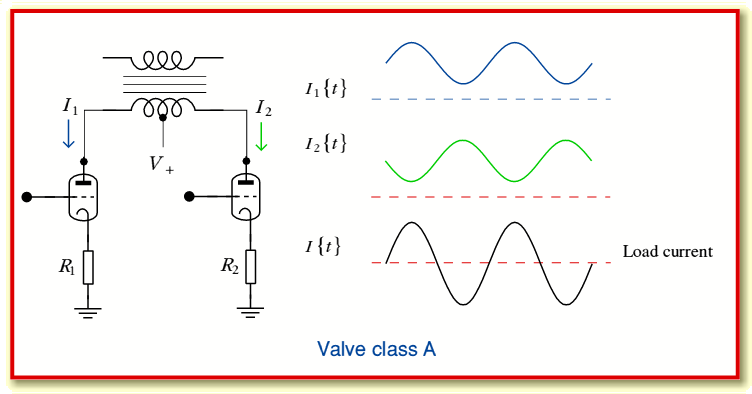
The diagram above illustrates a typical output arrangement used in many valve power amplifiers. Here a pair of valves are operated in opposition to vary the total magnetic flux generated by the primary of an output transformer. With this arrangement the total rail current drawn from the positive supply (and sunk to ground) is nominally constant irrespective of the signal waveform shape. Even when the valves are imbalanced in some way, any rail current variations will have a shape similar to the signal. Hence in this topology there is either no/little variation to potentially affect the signal, or it is relatively benign as in the “Class A” case.
The key point to draw from the above examples is that Class AB designs can have various distortion mechanisms whose contributions may depend upon the details of the signal. In particular, upon its symmetry. Tests using entirely symmetric waveforms may not expose these problems in a specific design. Class A systems may be able to avoid some significant signal distortion mechanisms, but this may not be evident when comparing various amplifier topologies simply using sinewave tests. Hence employing symmetric waveform tests alone may not help us assess the relative merits of the different amplifier arrangements.


