Noise and Dither
In reality, any microphone systems or other sensors used to detect sound pressure changes (and hence used to record music, speech, etc), will also pick up and create themselves some random noise. By ‘noise’ here I don’t mean interference like someone whistling in another room, or using a drill in an nearby studio, I mean that the air molecules will be rattling about with random thermal movements, and that the electrons in wires also rattle about in similar random ways. This noise level may be quite small, but its effect is very important. The amount of information (how much detail, etc) in a real analog signal contains is always finite, and limited by the amount of noise that is always present. The formal details of this are laid out in the papers published by Claude Shannon and others, and repeated in many textbooks on this topic.
The quantisation problem we described earlier comes from the perfect regularity of the series of bands and how these affect our waveform. We assumed the waveform was a perfect sinewave with no noise or other contributions. Yet in reality any sound measurement will have random noise covering or fogging the tiniest details. Since noise varies unpredictably the effect varies from one sample to another in a random way, breaking up the statistical regularity of the quantisation. This limits how precisely we can make a meaningful measurement or take a sample. It also has another quite remarkable and surprising effect that turns out to be very useful.
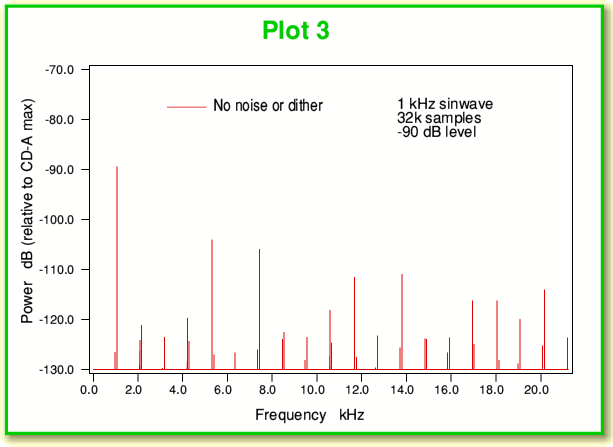
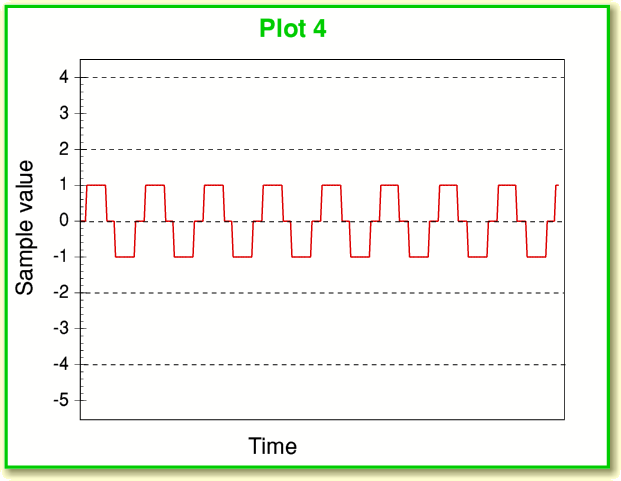
Plot 3 shows the spectrum of a low-level 1kHz sinewave. In this case it is at the -90 dB level – i.e. a thousand million times fainter than the loudest 1 kHz sinewave we could have recorded on a CD-A. Looking at this we can see that the intended 1 kHz signal is accompanied by a set of unintended distortion components. The largest of these are at about the -105dB level, and there are a number of them. (i.e. less than 15dB below the intended sinewave.) Hence they represent a high level of distortion. We can see what is happening if we plot a series of the recorded sample values against time as shown in Plot 4, below.
The problem is that sinewave now has such a tiny amplitude that it only swings up and down over a few bands when sampled, hence in the absence of any noise or any other effects we get a series of sample values that shows the pattern drawn in red in Plot 4, above. The waveform can be seen to look nothing like a sinewave, and just shows movements between ‘flat’ periods residing at just three levels. Given this shape we can see why the spectrum (also shown in red in Plot 3) exhibits a series of frequency components that were not intended to be part of the sinewave.
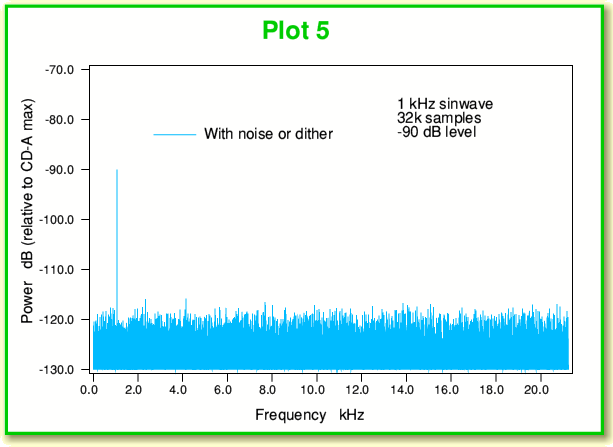
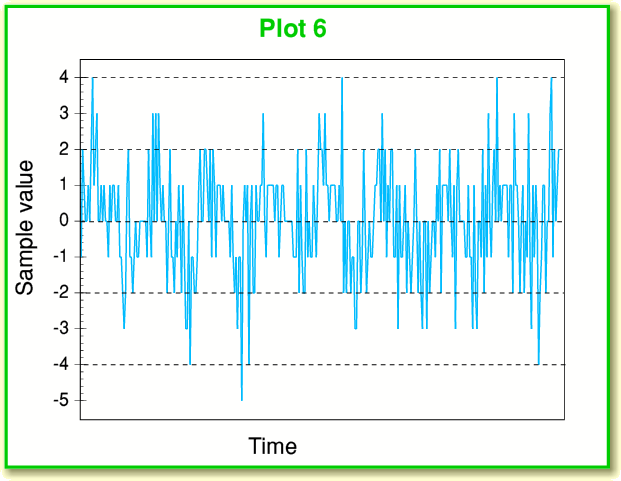
Now let’s look at the results of sampling an input that consists of our low level 1 kHz sinewave, but in the presence of random noise. The resulting spectrum for a -90 dB sinewave plus some noise is shown in Plot 5. This looks very different to the previous example (Plot 3) where we had no noise. The distortion spikes reaching up to -105 dB have vanished. Instead we have what looks like a white noise spectrum accompanying the intended sinewave, and its level is at around -120dB – i.e. well below the peak levels of the distortion we had when no noise was present. The change can also be seen by comparing Plot 6, below with Plot 4.
What we now see is noise, but combined with the 1kHz oscillation. In fact, when we look at the above plot of the time sequence of sampled values the sinewave is hard to see by eye, but when we perform the transform and look at the spectrum – there it is!
This result arises because the added noise breaks up the tendency for every sinewave cycle to be distorted into exactly the same (incorrect) shape as all its neighbours. A regular and repetitive distortion is replaced by a noise background. When we record signals which come with a natural noise level that is larger than the step between bands (quantisation level) of the sampling process then we may not have to deliberately add any noise. However when the signal is almost free of noise we end up with the curious result that deliberately adding some noise can improve the results by removing the unwanted distortion.
The deliberate addition of a random (or pseudo-random) pattern to achieve this effect is called ‘dithering’. Although I am not trying to cover all the details here, this technique can be applied in various ways, but the simplest to understand is just to ensure we have some ‘noise’ along with the signal, and make sure the noise is big enough to waggle up and down over at least a couple of bands between sample values. In some cases this pseudo-random addition is deliberately modified in response to the signal as it arrives and/or is designed to produce a sequence of sample values signal whose noise spectrum is not uniform but has lower noise at the frequencies where human hearing is most sensitive. These methods are often called ‘noise shaping’. Hence in many cases the techniques used to remove distortion and minimise the audibility of the resulting noise are lumped together.
Page 2 of 4


