The IQ-Test is a method for measuring the rate of replay of a stereo (or multichannel) digital system. In essence it is a form of ‘wow and flutter’ measurement. The approach is based on general FM and comms theory.
We can represent a sinusoid using an expression of the form
where  is the frequency of the sinusoid and
is the phase at any given instant.
This means we can define or measure the frequency via
i.e. by observing how much the phase changes,  , in a given time,
  .
.
For a waveform whose frequency also varies with time we can use this approach to measure the effective frequency during any short portion of time. Thus it gives us a way both to determine the overall value averaged over a long time (thus finding out if the system is playing consistently ‘slow’ or ‘fast’), and to detect how the frequency may alter as time passes. To do this we need to be able to determine the phase at each instant of interest.
A practical snag with single channel (i.e. mono) signals is that we need to examine the waveform over a duration long enough to be able to identify which portion of the sinusoid we have, and thus which phase it will have for any instant. However IQ modulation and demodulation (as widely used in modern communications) provides an easier approach. This is based on having two waveforms transmitted in parallel. These share the same frequency and amplitude. But they differ in phase by ninety degrees. We then say one of these is the ‘In Phase’ component (I) and the other is the ‘Quadrature’ component (Q) of this composite IQ waveform. This approach has a number of convenient mathematical features that make determining the phase much simpler.
Since modern domestic audio generally provides at least two channels (for stereo) we can therefore use these to convey an IQ pair as the test waveform. To perform IQ-Test measurements I generated a set of LPCM Wave audio data files. These had various sample rates and bit-depth sizes. But in each case the left channel was used as the ‘I’ channel and the right as the ‘Q’ channel. i.e. The left channel was a sinewave and the right a cosine wave, sharing the same frequency and waveform peak amplitude.
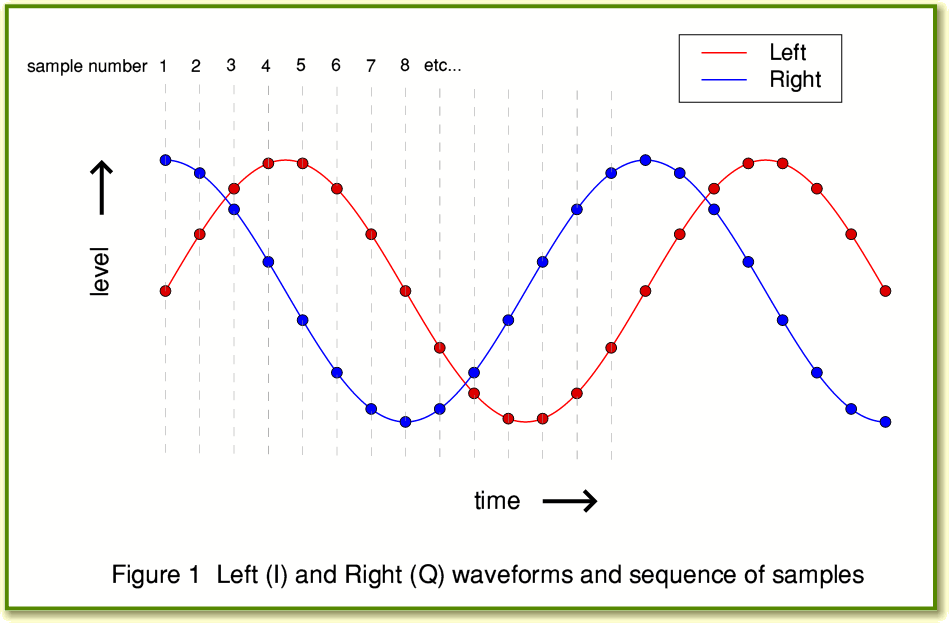
Figure 1 shows an example of this type of test waveform. In this case the frequency has been chosen to have 14 sample (pairs) per cycle. So if it were being played at 44·1ksamples/sec the resulting sine and cosine waves should emerge from a DAC with a frequency of 3,150 Hz.
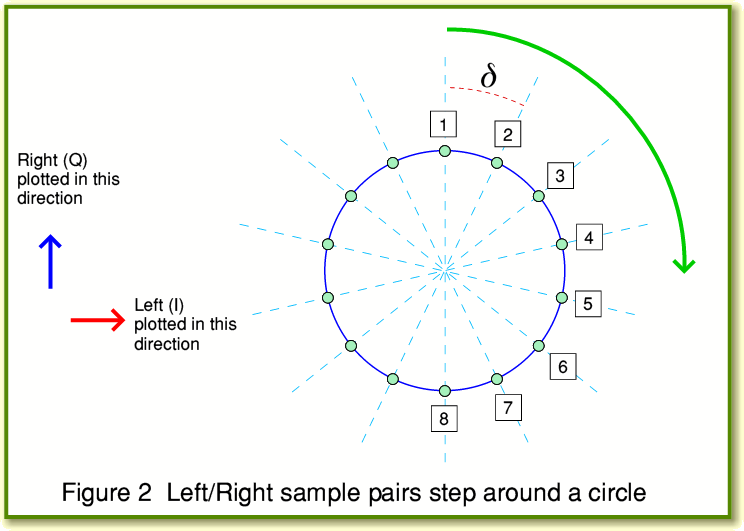
Figure 2 shows the same series of sample values, but this time plotted as an X-Y graph with the Left and Right sample pairs being used as the values. The result shows that as we step from one left/right pair to the next we are essentially moving around a circle. The spacing between successive left/right pairs of values is an angle  . In effect, the output waveform will – if converted to an analogue pair perfectly by a DAC – move smoothly around a circle at a rate of
  rotations per second. i.e. a rate of change in phase angle of
  radians per second. Figure 2 serves as a useful graphic to show the link between frequency and rate of change of phase by allowing us to think of the IQ waveform as a steady rotation.
In mathematical terms the above is a phasor representation and we are now regarding the sinusoid as a complex value
The Left (I) and Right (Q) components represent the real and imaginary parts of this complex number, and a sinusoid is a steady rotation around a circle.
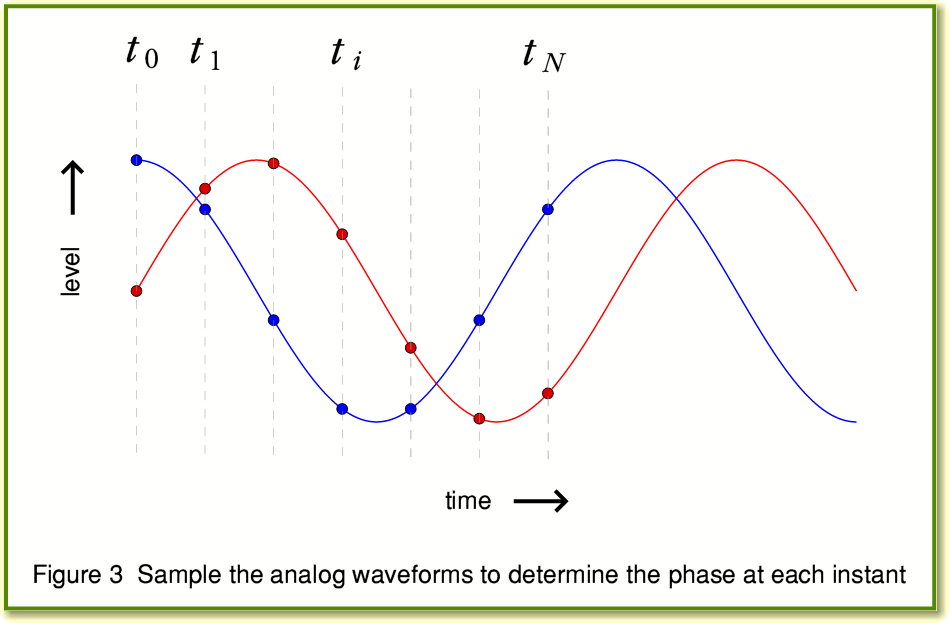
Turning the above argument on its head we can now measure the phase of the IQ pair at any chosen instant in time. Figure 3 illustrates this process. Here we have sampled the Left and Right channel at a series of instant,  . This gives a set of values for Left and Right we can call
  (Left) and
  (Right). The phase at any sampled instant will be
Using this we can measure the change in phase,  , between two different sampled instants a time,
  , apart. Then use the expression
to obtain the effective frequency during that time interval. Knowing in advance that the actual intended waveform should be s pure sinusoid of a specific frequency,  , we can then say that any departure from this value
is caused by the rate of replay not being precisely as intended.
In principle we can repeatedly determine this for each successive pair of sampled instants. So for example if we are sampling the analogue waveforms at 192k samples/sec we can observe any variations in rate from sample to sample at that rate. In practice, though, it may be more useful to do measurements integrated over a number of samples since this will produce more accurate results with higher resolution – at the expense of not being able to examine brief variations that last for a time shorter than the chosen integration time. In practice we also need to examine each phase change between successive samples to watch for the situation where the arctan function passes though the  fold. This causes a cyclic ‘jump’ in the value returned by the arctan function which we can detect and correct provided our sample rate is high enough to ensure that the normal change in phase between successive samples is much less than
  . However these are practical details which we just need to deal with as appropriate for a given measurement and data analysis.
Another practical choice is the selection of the frequency we choose for the IQ waveform. In theory we can choose any frequency we prefer for the waveform we wish to use. There is a good theoretical reason for wishing to choose the highest frequency we can. This is because the change,  , scales with the choice of
  . i.e. if the replay rate is in error by, say, 0·01% then this will alter the output frequency by 0·01%. However 0·01% of 100Hz is 0·01Hz, whilst 0·01% of 10kHz is 1 Hz. Hence the higher the chosen IQ-Test waveform frequency, the bigger (and hence more easily observable) the change in replay frequency. This is one of the reasons why the J-Test tends to be carried out using high frequency waveforms to maximise the sensitivity of the measurement.
However choosing a high frequency has some drawbacks. One is that a test tone above, say, 10kHz had very little in common with normal music or speech. Another is that if there is a sudden gap or jump in the data replay sequence it might last longer than one cycle of the test waveform, and won’t be adequately observed. (This if for the same cyclic reason as we need to ‘stitch’ the arctan output to cope with the finite  phase range it can report.) When using a nominally pure sinusoid as the test waveform it may also be useful to be able to arrange for the waveform to ‘cycle’ around a set sequence of sample values. This ensures that each cycle of the waveform is either identical to all the others (when undithered) or only differs from the others due to the addition of random dithering. This helps reduce unwanted background phase noise, etc.
A practical example
To illustrate the use of the IQ-Test I can use the example of the measurements I carried out on the Halide Design USB-SPDIF Bridge. (If you wish the see the results of those measurements, click here.)
Note that choosing Left = I and Right = Q rather than the other way around is an arbitrary decision. From a theoretical point of view the method would work if done using Right = I and Left = Q. All that is required in practice is that the choice made is consistent between the test waveforms and the measurement analysis. If an error is made and the Left and Right channels are reversed during measurement then the only consequence is that all the computed phases, frequencies and times change sign. i.e. The outcome is negative values which have the correct magnitudes. So when examining any results this can be used as an indicator that such a reversal has accidentally occurred!
The computer I used as a source was a Shuttle running Ubuntu Linux. I used the standard ALSA system to control sound interfacing. In addition to the Shuttle’s own internal soundcard I made two USB connections. One direct to the USB interface of a DACMagic. The other to the Halide Bridge which then fed its SPDIF output to the DACMagic. To define the interface to the USB devices I put the following into my .asoundrc file.
pcm.!default {


type plug


slave {


pcm "hw:2"


channels 2


format S24_3LE


}


}


pcm.plug1 {


type plug


slave {


pcm "hw:1"


channels 2


}


}


pcm.plug0 {


type plug


slave {


pcm "hw:0,1"


channels 2


}


}
From the order in which the devices are recognised at startup, "hw:0,1" is the internal card’s spdif output, "hw:1" is the USB connection direct to the DACMagic, and "hw:2" is the USB connection to the Halide Bridge. The pcm.!default section above tells ALSA to regard the Halide Bridge as the sound sink to use for playing audio unless some other output is specified when playing. It also tells the system to send data to the Halide Bridge in the S24_3LE format.
Under normal circumstances I tend to use two programs for playing music files or streaming net radio, etc. These are AlsaPlayer and Audacious. Unfortunately, both of these have limitations which ruled them out as suitable for my tests on the Halide Bridge. AlsaPlayer refused to play any files with sample rates above 48k. Audacious – despite having a setting for 24bit output – sent 24bit sound as truncated 16bit values. Hence neither were suitable for tests involving 24bit files and rates above 48k. So instead I used the simple ‘aplay’ command which is part of the normal ALSA package. This played LPCM files of any rate I tried, and gave bit-perfect output for both 16bit and 24bit as appropriate. Given the setup I have described I can play an LPCM Wave file named, say, fred.wav, by using aplay fred.wav to have the results play via the (default) Halide Bridge or use aplay -D plug1 fred.wav to have the result play via the direct USB connection to the DAC.
For the measurements I decided to use test files which had a simple integer number of sample (pairs) per cycle. This meant that when using undithered sample values I could ensure the waveform sample sequence was perfectly repetitive with exactly the same defined shape for each cycle. Although this means an undithered waveform isn’t necessarily a totally pure sinusoid (pair) it means that any error is cyclic and repeats precisely cycle-by-cycle. Hence if phase measurements are made over a time interval of an integer number of cycles any phase errors within a single cycle become null. I also decided to use a number of samples per cycle that produced an output IQ waveform frequency that was an integer multiple of 50Hz. This was combined with a decision to use integration times that were one cycle at 50Hz – i.e. 20 ms. The aim here was to try and filter any effects due to residual UK mains hum and reduce their effect on the results. Subsequent experiments showed that for the system I was using this wasn’t actually a problem. But it may be in some cases. The table below lists various possible choices that meet the requirements I decided to apply.
Table of frequencies (kHz) where an integer number
of samples/cycle gives a frequency that is a multiple of 50Hz.
| vals/cycle
|
2
|
3
|
4
|
5
|
6
|
7
|
8
|
9
|
10
|
| 44·1k
|
22·05
|
14·7
|
-
|
-
|
7·35
|
6·3
|
-
|
4·9
|
-
|
| 48k
|
24
|
16
|
12
|
9·6
|
8
|
-
|
6
|
-
|
4·8
|
|
|
12
|
14
|
15
|
16
|
18
|
20
|
21
|
|
|
| 44·1k
|
-
|
3·15
|
-
|
-
|
2·45
|
-
|
2·1
|
|
|
| 48k
|
4
|
-
|
3·2
|
3
|
-
|
2·4
|
-
|
|
|
In practice I decided to choose 14 samples per cycle (3,150 Hz) for the 44·1k sample rate and 15 samples per cycle (3,200 Hz) for the 48k sample rate. I also decided to use the same frequencies for the multiples of these rates. So, for example, that meant using 30 samples per cycle for 96k sample rate to obtain the same nominal IQ wave frequency as 48k.
The recordings of the analogue output of the DAC were made at a sample rate of 192k (24 bit samples) in every case. This was to minimise the amount of phase change between successive sample pairs and get as much data as possible in case this eased analysis. In practice a lower sample rate may be fine, but I have not explored that at present.
Having experimented with other choices, the final measurements used a 20 ms integration time and the 14/15 cycle rates. In practice, almost any choice of settings and rates could be used. For example, for some purposes a much higher test frequency could be chosen for the IQ waveforms – thus giving higher sensitivity to short-term timing errors. Alternatively much lower frequencies – say around a few hundred Hz – could be chosen if it was felt better to use waveforms with a frequency more representative of sustained music and the interest was in long term variations.
2200 Words
Jim Lesurf
4th Mar 2011


