On The Record
Last month I examined some of the physical factors that limit the maximum sound levels we can expect to be recorded onto a vinyl LP. To recap, the main findings were that we should expect that the maximum possible modulation velocity levels will be around +20dB relative to the standard reference level of 5cm/sec, and maximum accelerations will be around 5,000 gravities. These limits will depend on the details of how the LP was made and played back, as discussed last time. There are also other factors which I ignored that can affect the results. Having done the theory, what kind of results do we get in practice?
Figure 1
To investigate, I made digital recordings of some LPs having first calibrated my recording system using the reference levels on some test discs. I used my old Shure V15/IIIMR to make the recordings because – despite its age – it can still easily track high modulation levels.[1] I then processed the results to undo the RIAA correction and recover the pattern of velocity variations on the LPs. Figure 1 shows the first example. The plots are similar to ones I have produced previously. The audio waveforms were divided into a series of 100 millisecond ‘chunks’ and the peak levels during each chunk is found. The graphs then display probability histograms. In effect, they show what percentage of the time the music is reaching a given peak level. However there are some significant differences from before. Firstly, you can see that I now have two plots – one for the velocities on the disc, the other for the accelerations. Secondly, instead of showing results for the Left and Right channel, I have shown results for the Horizontal (mono) and Vertical (stereo difference) modulations on the LP.
Figure 1 is based on the track “Smoke on the Water” by Deep Purple. It is the first track from one side of the LP “Machine Head” which I bought some decades ago, and has an unusual recording history. Looking at the velocity plots we can see that the peak levels do approach the level predicted in the last article. However we can see that the maximum accelerations experienced during the track were around 1,000 gravities – high, but well below the theoretical maximum. This is good news if you are playing the LP with a stylus that has a high tip mass! One intriguing feature of the results is that the Horizontal and Vertical distributions are noticeably different. The results look as if the Horizontal levels have been compressed upwards in volume, or that there is a large amount of ‘pan pot’ near-mono sounds added to the mix.
Figure 2
For Figure 2 I’ve chosen a very old LP of classical music I bought in the 1960s. As you might expect for classical orchestral music, this shows a much wider spread of modulation levels, and is typically much quieter than the rock/pop examples. In fact, this track is a ‘filler’ on the LP. It starts partway across the side, and continues to the end-of-side. Hence it will be limited to lower peak modulation velocities than the first example. Here the shapes of the Horizontal and Vertical modulation distributions are much more similar to one another than in the Deep Purple example. This implies that the recording was more ‘natural’ in the way it was made, with significant amounts of randomly phased ambient sounds, etc. Also that the producers were less worried about getting loud results and the cutting/tracking problems that high levels may cause.
The above examples are relatively old, traditionally manufactured 33 rpm LPs. I looked at a variety of discs and although the details varied, the above results seemed fairly typical. But what about more modern discs – in particular, ones that have various ‘audiophile’ credentials? Various specialist manufacturers make claims, describing the lengths they go to in order to get excellent results. Some of the methods they adopt won’t have any impact on the maximum levels which can be recorded, but may have other benefits. e.g. lower levels of surface noise. But do they also deliver higher peak levels and provide better dynamics for that reason? Some makers also cut discs at 45 rpm, which should allow for an increase in the peak modulation levels. Since 45 rpm is 35% faster than the standard LP it should allow for just under a 3dB increase in the maximum modulation velocity.
Figure 3
Figure 3 shows the results from a 45 rpm 12" single by ZZ Top. Chosen simply on the basis that it sounded ‘very loud’. This does reveal maximum velocities which are slightly higher than the previous examples. But the maximum accelerations aren’t much different, despite being a much more modern recording. Note that once again there is a large discrepancy between the mono and difference signals, with the most common difference level generally being over 10dB below the typical mono level. The distributions look like the sound has been heavily level-compressed and processed for maximum loudness. Perhaps fair enough in this case, and I doubt that ZZ Top fans will be bothered much by the lack of a natural acoustic!
As well as producing information on how often various velocity and acceleration levels occur, the analysis I did can also shine some light on what frequencies in the signal patterns are dominating the results.
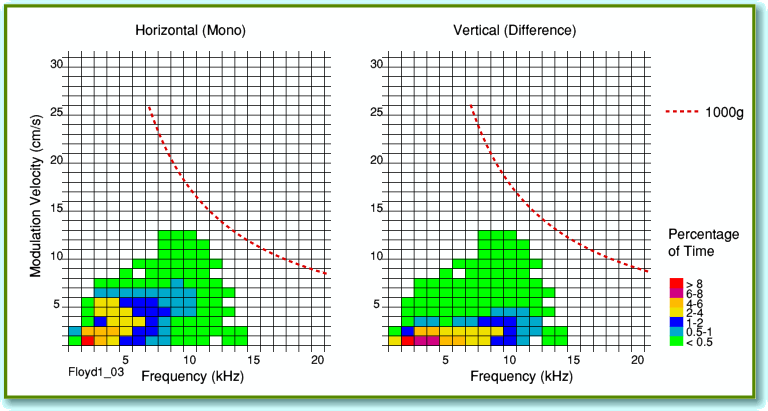
Figure 4 shows some ‘3-dimensional’ histograms taken from the ZZ Top example. Here the peak level for each 100 millisecond chunk of music is plotted against the effective frequency of waveform during the chunk. The colours in the rectangles of the grids show how often a given combination of frequency and velocity occurred. The plots spread out the general distributions and show what relative contributions come from various frequency bands. I’ve also plotted a broken red line to show where a given combination of velocity and frequency would require accelerations of 1000 gravities. The two plots in Figure 4 are for the Horizontal and Vertical modulations. The results confirm that in this example the behaviours are noticeably different in these two modulation directions.
Figure 4
The frequencies shown here don’t mean that no components exist at higher (or lower) frequencies, just that they only make a minor contribution to the peak velocity and acceleration detected during each chunk. Also, bear in mind that these results are for the ‘raw’ modulation on the LP. RIAA correction would tend to reduce the relative amplitudes of high frequency components. If you did a similar analysis for the RIAA-corrected output the distributions would tend to shift downwards in frequency. So the results show what is on the LP, not the spectrum you hear after normal RIAA correction.
Figure 5
As a complete contrast to ZZ Top, Figure 5 shows the results from a recording of Bach’s Trio Sonata in C, BWV1037 as performed by Jaap Schroder, Stanley Richie and others on a half-speed mastered LP produced by Reference Recordings around ten years ago. These plots show a more limited dynamic range for the performance than the Firebird example. Hardly surprising as this is a small-scale chamber work. The extended low-level ‘tails’ of the distribution do indicate that the actual recording has a low background noise level and that the vinyl pressing is exceptionally good. In this case the Horizontal and Vertical modulation distributions are very similar. This is all consistent with a fairly simple recording technique that captures the natural ambience. The low modulation levels will help minimise any distortions when the disc is played, and the quiet LP surface should avoid this leading to annoying background noises.
Figure 6
Figure 6 shows the modulation/frequency statistics for the Bach. As you would expect this confirms that the signals on this LP track spend most of their time at low modulation levels. The patterns for Horizontal and Vertical modulation are also very similar in this case.
Figure 7
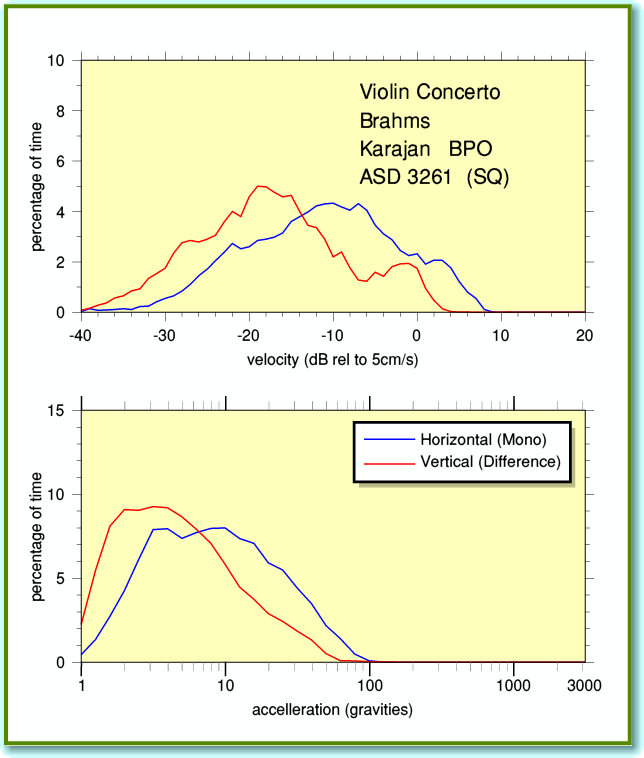
Purely for the sake of curiosity I can also give the results for two other cases. Figures 7 shows the results from a ‘Quadraphonic’ LP which was produced in the 1970’s. Younger readers may not remember Quadrophony. This was an early attempt at getting music lovers to surround themselves with speakers. The difficulty was that the manufacturers needed to squeeze the extra spatial information onto the existing LP and FM radio systems in a way that was also tolerable when played on a stereo setup. The result was systems that tended not to work very well, and could sound poor in stereo – plus the usual commercial fiasco of competing manufacturers pushing incompatible systems which vied for success. The result was predicted, and explains why you may never have encountered any of them. The systems all died out!
The ‘SQ’ process used by EMI used phase delays between the Left and Right signals to encode information for the rear channels. As a result, if you are familiar with the techniques used at the time you might expect that the results would give similar Horizontal and Vertical modulation levels. Yet Figure 6 shows this isn’t really so in the case of the SQ encoded Brahms Violin Concerto LP I’ve examined. In practice, the amplitude and phase of this extra info had to be carefully controlled to avoid the audio having an odd ‘phasey sound’ when heard using a stereo system. There were also worries that large amounts of Vertical modulation might cause problems for non Hi-Fi systems. Hence the ‘surround sound’ tended to be applied sparingly in classical recordings. This may be why Figure 7 shows results that have Vertical modulations which are at a lower level than the Horizontal, just like typical stereo examples.
Figure 8
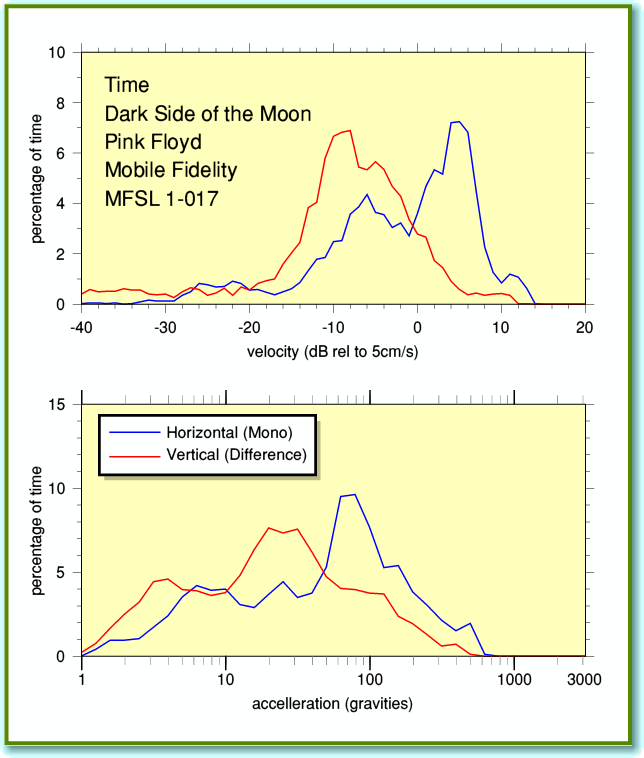
Results for the final example are shown in Figures 8 and 9. These are for the Mobile Fidelity LP of Pink Floyd’s Dark Side of the Moon. I couldn’t resist including this because it is so well known as an audiophile recording!
Figure 9
As with other pop/rock recordings this one also shows distinct differences between Horizontal and Vertical modulation. However the modulation levels are generally much lower than examples like ZZ Top, and the music covers a wider dynamic range!
The impression I have gained from the results I obtained (only some of which I had space for here) are that audiophile recordings primarily rely on careful production and the use of good quality materials to obtain excellent results. They may also deliberately avoid high modulation levels in order to minimise distortion problems when replayed. The price is the need to have very quiet vinyl pressings, and to treat the LP with care so as to avoid damage by dust, etc.
Unsurprisingly, classical recordings have wider dynamic ranges than commercial pop/rock and tend to spend less time pushing the envelope of what can be recorded. Intriguingly, though, even with classical music, there seems to be a consistent tendency for the Vertical modulation levels to be lower than the Horizontal. The stand-out exceptions which I found being the Reference Recordings Bach, followed by the old Firebird recording. This difference between Vertical and Horizontal, along with the tendency for the peak accelerations to be well below 5,000 gravities, are perhaps the most interesting general results from the survey.
Taken overall, the results indicate that a typical LP – even an audiophile one – may not be very demanding in terms of stylus accelerations. So perhaps people have been right to largely lose interest in tip mass as a stylus parameter. Judging by the examples I’ve examined, a tip mass around a milligram or so would probably be fine in terms of allowing the stylus to stay in the groove. This should be taken with caution, though, as there are other factors I’ve not yet discussed that might alter such a conclusion. Importantly, some discs do show peak modulation velocities well above 5 cm/sec. On that basis the old ‘trackability’ arguments that companies like Shure Brothers and others used to put forward seem justified. If you wish to play discs like the ones I’ve examined here you do need a cartridge that can track up to high modulation velocities. In terms of the theories I outlined last month, the results seem to be within the predicted limits. All being well, I may examine that again in a future article and see what reasons there may be for the accelerations falling short of what simple theory predicted would be possible.
The above shows the results I presented in the article printed in Hi Fi News magazine. Hiowever I actually analysed many more LPs than I had space to discuss in the magazine. I have therefore provided an extra webpage displaying a Gallery of examples of previously unpublished results to accompany this page.
2200 Words
Jim Lesurf
21st Sep 2007
[1] Yes, I know everyone else has decided they prefer moving-coil cartridges. But I am old-fashioned and I still prefer the Shure for the way it effortlessly tracks whatever you throw at it. Though I have no idea what I’ll do when the dread day comes and it ceases to work correctly. I keep hoping someone will find an old crate with some genuine NOS Shure replacement MR stylii in perfect condition for my V15/III. If they do, please let me know!


